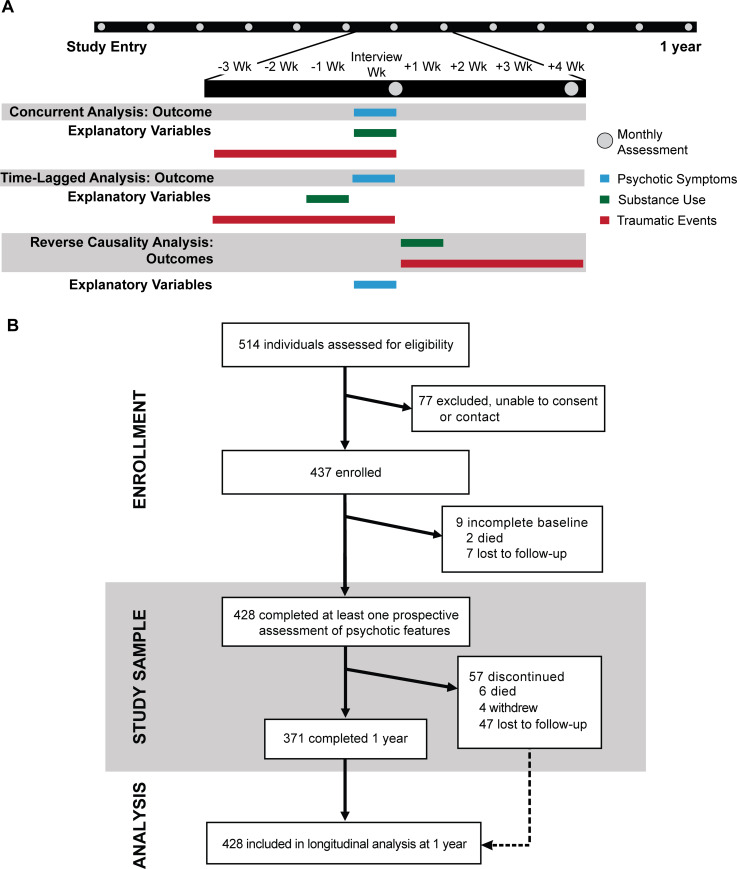
Fig 1.
Schematic of study design (A) and flow chart of participants (B) over the first year after study entry. Panel A depicts the study design to evaluate time-varying factors at monthly assessments over the first year after entering the study. At each monthly assessment visit (gray circle), psychosis in the past 7 days (“Interview week” in the Fig) is evaluated by a 5-item PANSS (blue bars). Substance use is evaluated week by week over the concurrent month using the Drug Timeline Follow-back approach (green bars). Traumatic events in the concurrent month are evaluated by the THQ (red bars). Panel B depicts participant flow in the enrollment, study samples, and data analysis for the psychotic features objective. Data analysis for the mortality objective incorporated outcomes for all participants from the study beginning (November 1, 2008) to the end of the mortality analytic period (November 15, 2018). PANSS, Positive and Negative Syndrome Scale; THQ, Trauma History Questionnaire.

