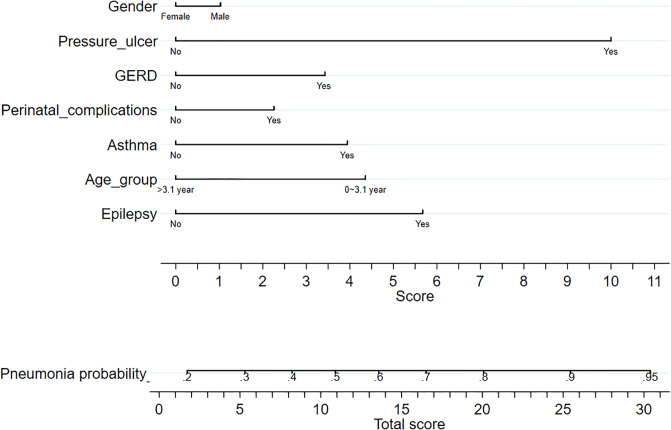
Fig 1. Nomogram plot for predicting severe pneumonia in CP children.
For an individual patient, each variable corresponds to a point in the 8th row (names “score”). The total points were summed up by all points and are indicated in the 10th row (the bottom row). Drawing a vertical line from total point to the 9th row will show the corresponding probability of pneumonia.

