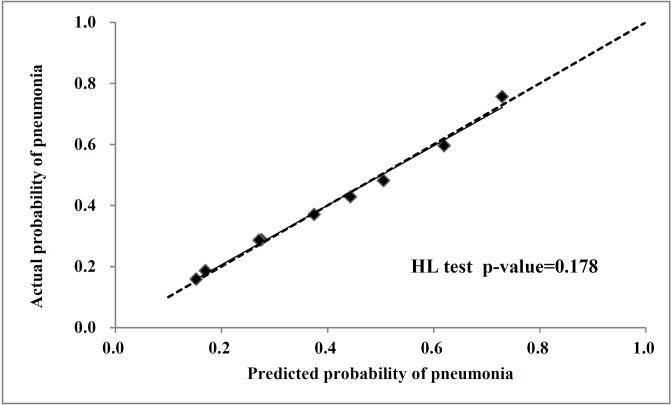
Fig 2. The calibration curve for the radiomics nomogram plot.
Dashed line indicates ideal reference line where predicted probabilities would match the observed proportions (the diagonal square) and, of which a closer fit to the diagonal dotted line represents a better prediction. The Hosmer-Lemeshow test showed the p-value is 0.178.

