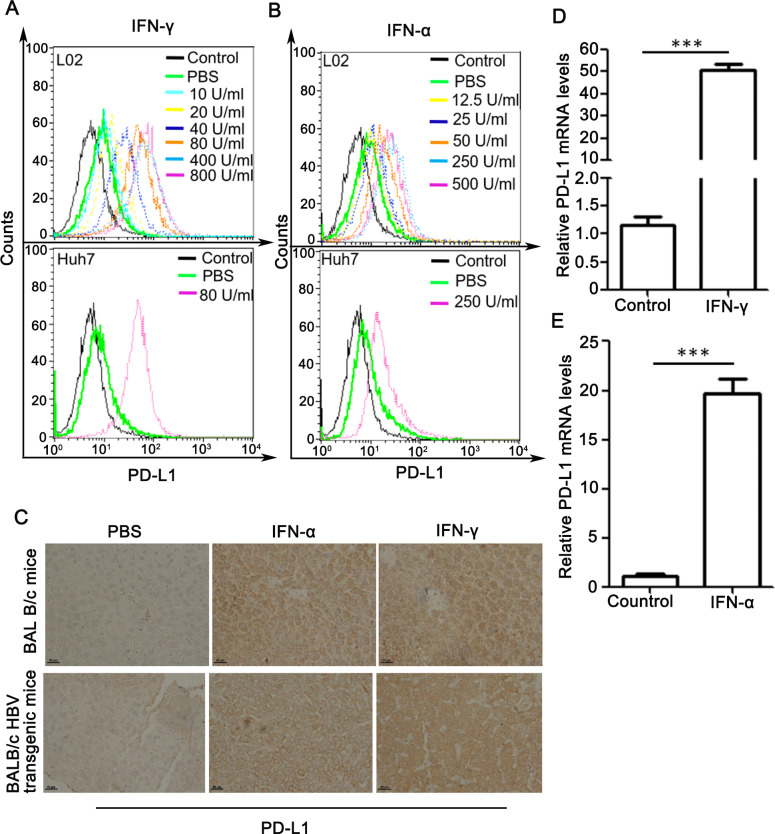
Fig 1. Effect of IFN-γ and IFN-α on PD-L1 expression both in vitro and in vivo.
(A and B) L02 and Huh7 cells were treated with IFN-γ (A) or IFN-α (B) at indicated concentrations for 48 h. Flow cytometric analysis was performed to detect cell membrane PD-L1 levels. Cells stained with control IgG served as a negative control. (C) BALB/c or BALB/c HBV transgenic mice were treated with PBS, IFN-α, IFN–γ, as described in Materials and Methods. IHC analysis was performed for detection of PD-L1 expression levels in mouse livers. Scale bars, 50 μm. (D and E) Real-time PCR analysis of PD-L1 mRNA levels in L02 cells treated with IFN-γ (D) or IFN-α (E) or PBS as control for 48 h. The relative mRNA levels of PD-L1 were normalized to the housekeeping gene actin. Data are presented as mean ± SD for three independent experiments. *** p<0.001 compared to the control.

