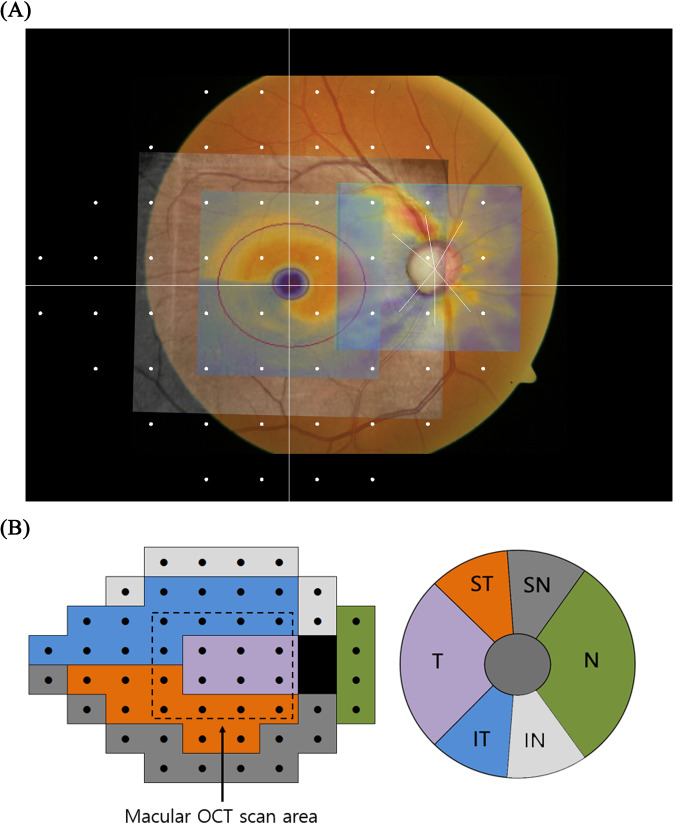
Fig 2. Visual field test pattern and Garway-Heath map.
(A) A colour fundus photo with Humphrey 24–2 visual field test pattern and two optical coherence tomography (OCT) images were overlapped on the fundus photo. Garway-Heath sectorisation (white radiating line) is drawn on the optic nerve head centre. (B) Regions of visual field test points outlined by Garway-Heath sectorisation map. The central dashed square shows the boundary of the macular OCT scan area and the surrounding area is defined as the peripheral OCT scan area. IN: inferonasal, IT: inferotemporal, N: nasal, SN: superonasal, ST: superotemporal, T: temporal.

