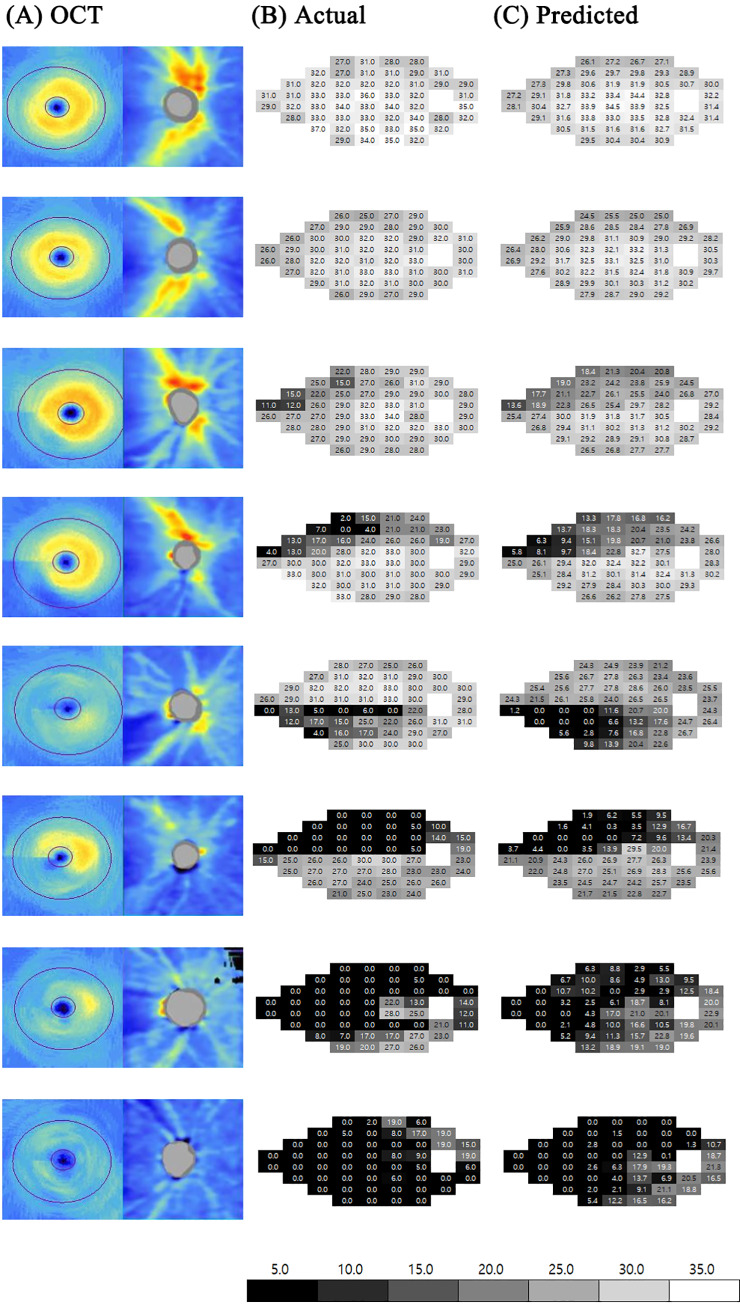
Fig 3. Representative cases of visual field prediction.
(A) The combined OCT images, which were input into the deep learning architecture, are shown on the left column. The actual threshold values of visual field exams are shown in the (B) middle panel and the threshold values predicted by Inception V3 based deep learning architecture are shown on the (C) right panel. The colour reference for the threshold values are shown at the bottom. Despite the artificial intelligence having never seen the actual visual field, the predicted visual field looked very similar to the actual visual field exam.

