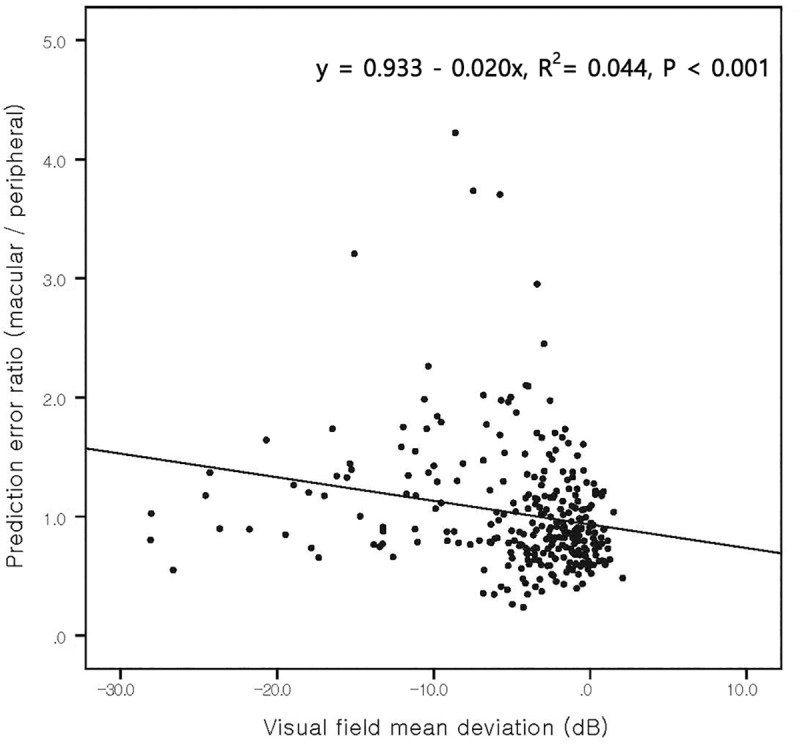
Fig 5. Scatter plot of the prediction error ratio (macular/peripheral) versus the visual field Mean Deviation (MD).

The slope was –0.020 (P < 0.001) which suggested that as the MD decreased, the macular prediction error became higher than the peripheral prediction error. In other words, as glaucoma progressed, the peripheral prediction became more accurate than the macular prediction.
