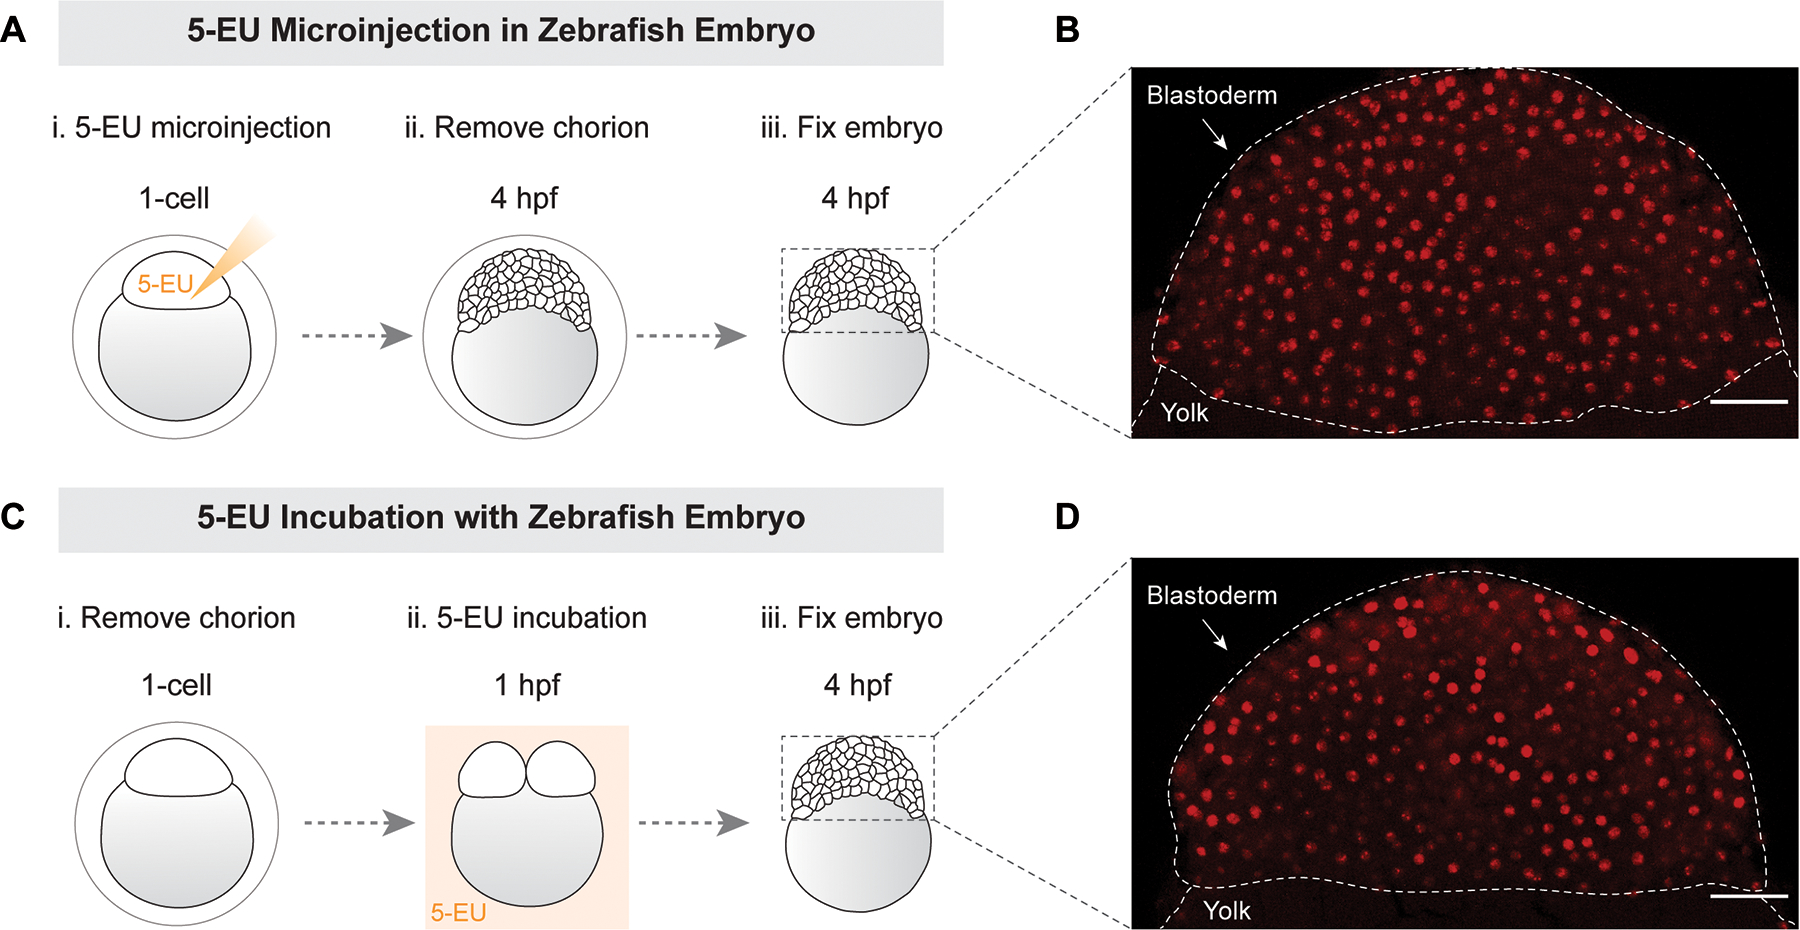
Figure 4. Labeling and imaging nascent transcripts in zebrafish embryos.

(A) schematic of 5-EU microinjection in the blastodisc at 1-cell stage. (B) chorion was removed prior to fixation at 4 hpf. Image of 5-EU in blastoderm from 5-EU injection. (C) schematic of zebrafish embryos incubated with 5-EU following chorion removal. (D) image of 5-EU in blastoderm from 5-EU incubation. Confocal imaging at 25× magnification. Maximum intensity projections of Z-stacks for embryos (only blastoderms are shown). The dashed lines indicate the shape and position of blastoderm relative to yolk. Scale bar 50 μm.
