
Extended Data Fig. 4: RMMAI enrichment at mo-2 minisatellite arrays in the PAR and on specific autosomes.
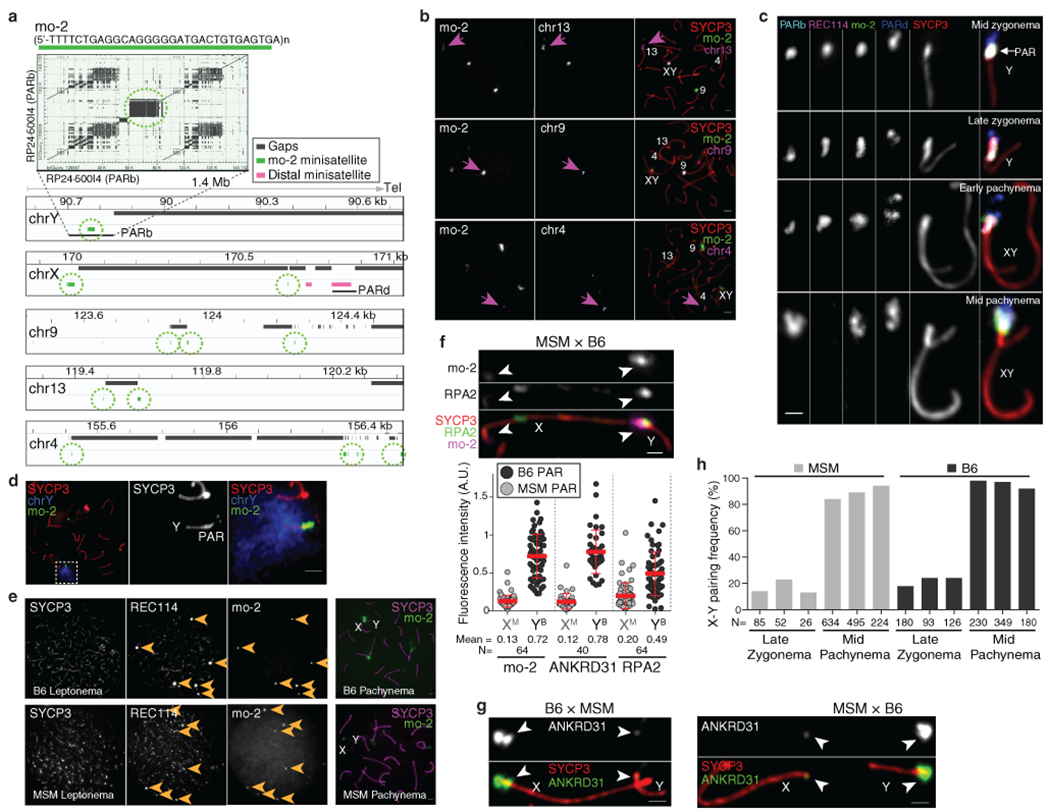
(a) Top panel: Self alignment of the PARb FISH probe (reproduced from Fig. 2a). The circled block is a 20-kb mo-2 cluster. Bottom panel: Schematic depicting the last 1.4 Mb of the non-centromeric ends of the indicated chromosomes, showing the positions of mo-2 repeats (green) adjacent to assembly gaps (mm10); mo-2 repeats were identified by BLAST search using the mo-2 consensus sequence. Mo-2 repeats also appear at the distal end of chr4 in the Celera assembly (Mm_Celera, 2009/03/04). PARb and PARd BAC clones are indicated. (b) Confirmation that autosomal mo-2 FISH signals match the chromosomal locations indicated by mm10 or Celera genome assemblies. FISH was performed using an oligonucleotide probe containing the mo-2 consensus sequence in combination with BAC probes for adjacent segments of chromosomes 13, 9 and 4, as indicated. Magenta arrows point to concordant FISH signals. The chr9 BAC probe also hybridizes to the PAR. Scale bars: 2μm. The colocalization of mo-2 and the three autosomal FISH signals was observed in two mice (N>20 spermatocytes). (c) Comparison of mo-2 FISH with REC114 localization relative to the PAR boundary (PARb FISH probe) and the distal PAR (PARd probe). In mid zygonema, the mo-2 FISH signal colocalizes well with REC114 staining in between the PARb and PARd FISH signals. In late zygonema, mo-2 and REC114 are similar to one another and are elongated along the thickened SYCP3 staining of the PAR axis. From early to mid pachynema, REC114 progressively disappears, whereas the mo-2 FISH signal becomes largely extended away from the PAR axes. Note that the relative positions of the PARb and PARd probes reinforce the conclusion that the PAR does not adopt a crozier configuration. Scale bar: 1 μm. The different positioning of PARb and PARd FISH signals compared to mo-2 or REC114 signals was observed in more than 30 spermatocytes in at least three mice. (d) Illustration of the compact organization of the PAR chromatin (mo-2 FISH signal) compared to a whole-Y-chromosome paint probe. Scale bar: 2 μm. The costaining of mo-2 and full chrY probe was evaluated in one mouse (N>20 spermatocytes). (e) Lower mo-2 copy number in the M. m. molossinus subspecies correlates with lower REC114 staining in mo-2 regions. The left panels compare MSM and B6 mice for the colocalization between REC114 immunostaining and mo-2 FISH in leptotene spermatocytes. The REC114 and SYCP3 channels are shown at equivalent exposure for the two strains, whereas a longer exposure is shown for the mo-2 FISH signal in the MSM spermatocyte. Note that the mo-2-associated REC114 blobs are much brighter relative to the smaller dispersed REC114 foci in the B6 spermatocyte than in MSM. The right panel shows representative pachytene spermatocytes to confirm the locations of mo-2 clusters at autosome ends and the PAR in the MSM background. Scale bars: 2 μm. The lower intensity of REC114 blobs in MSM compared to B6 was observed in N>30 spermatocytes in three different pairs of mice. (f) PAR enrichment for ANKRD31 and RPA2 correlates with mo-2 copy number. Top panel: late zygotene spermatocytes from MSM x B6 F1 hybrid. Scale bar: 1 μm. Bottom panel: PAR-associated signals (A.U., arbitrary units) on B6-derived (YB) and MSM-derived chromosomes (XM) from the indicated number of spermatocytes (N). Red lines: means ± SD. Differences between X and Y PAR intensities are significant for both proteins and for mo-2 FISH in both F1 hybrids (p < 10−13, paired t-test; exact two-sided p values are in Data File S5). (g) Representative micrographs of late zygotene spermatocytes from reciprocal F1 hybrid males from crosses of B6 (high mo-2 copy number) and MSM (low mo-2 copy number) parents. Scale bar: 1 μm. (h) Frequency of paired X and Y at late zygonema and mid pachynema analyzed in three MSM and three B6 males. Differences between strains were not statistically significant at either stage (p = 0.241 for late zygonema and p = 0.136 for mid pachynema; two-sided Student’s t test). Note also that MSM X and Y are late-pairing chromosomes, as in the B6 background. The similar pairing kinetics indicates that the lower intensity of RMMAI staining on the MSM PAR is not attributable to earlier PAR pairing and synapsis in this strain. The number of spermatocytes analyzed is indicated (N).