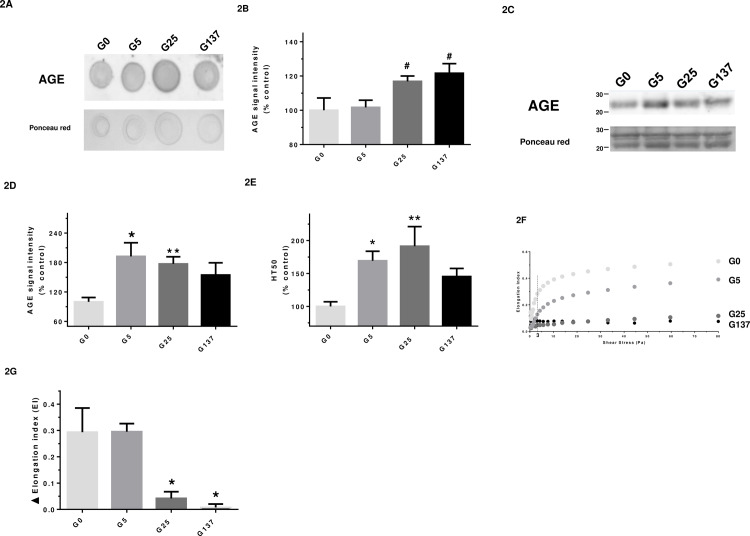
Fig 2. Glycated erythrocytes exhibit an impaired deformability capacity.
In this figure, G0, G5, G25 and G137 represent the four conditions of incubation to which erythrocytes were subjected: 0, 5, 25 and 137 mmol/l glucose, respectively. (A) Representative AGE dot blot performed on lysate preparations (n = 4); (B) Quantification of AGE signal normalized with Ponceau S signal in the different erythrocyte preparations. Results are expressed as mean ± SEM of 3 to 4 experiments performed independently. #p<0.05 vs. G5 (Student’s t test, n = 3 to 4); (C) Representative AGE western blot performed on lysate preparations (n = 4); (D) Quantification of AGE signal normalized with ponceau red signal in the different erythrocyte preparations. Results are expressed as mean ± SEM of 4 experiments performed independently. *p<0.05, **p<0.01 vs. G0 (Student’s t test, n = 4). (E) HT50 was measured by the free-radical hemolysis test as described in method section. Results are expressed as mean ± SEM of 5 to 8 experiments performed independently. *p<0.05, **p< 0.01 indicates a significant difference vs. G0 (One-way ANOVA followed by Dunnett’s test) n = 5 independent analyses; (F) Curves correspond to the elongation index of erythrocytes determined by LORRCA measurement as a function of shear stress intensity (Pa); (G) Histograms correspond to the calculated variation in elongation index (delta EI) reflecting capacity of erythrocytes to deform when submitted to a shear stress ranking from 0 to 80 Pa. Results are expressed as mean ± SEM. *p<0.05 indicates a significant difference as compared to G0 (One-way ANOVA followed by Dunnett’s test) n = 3 independent replicates.

