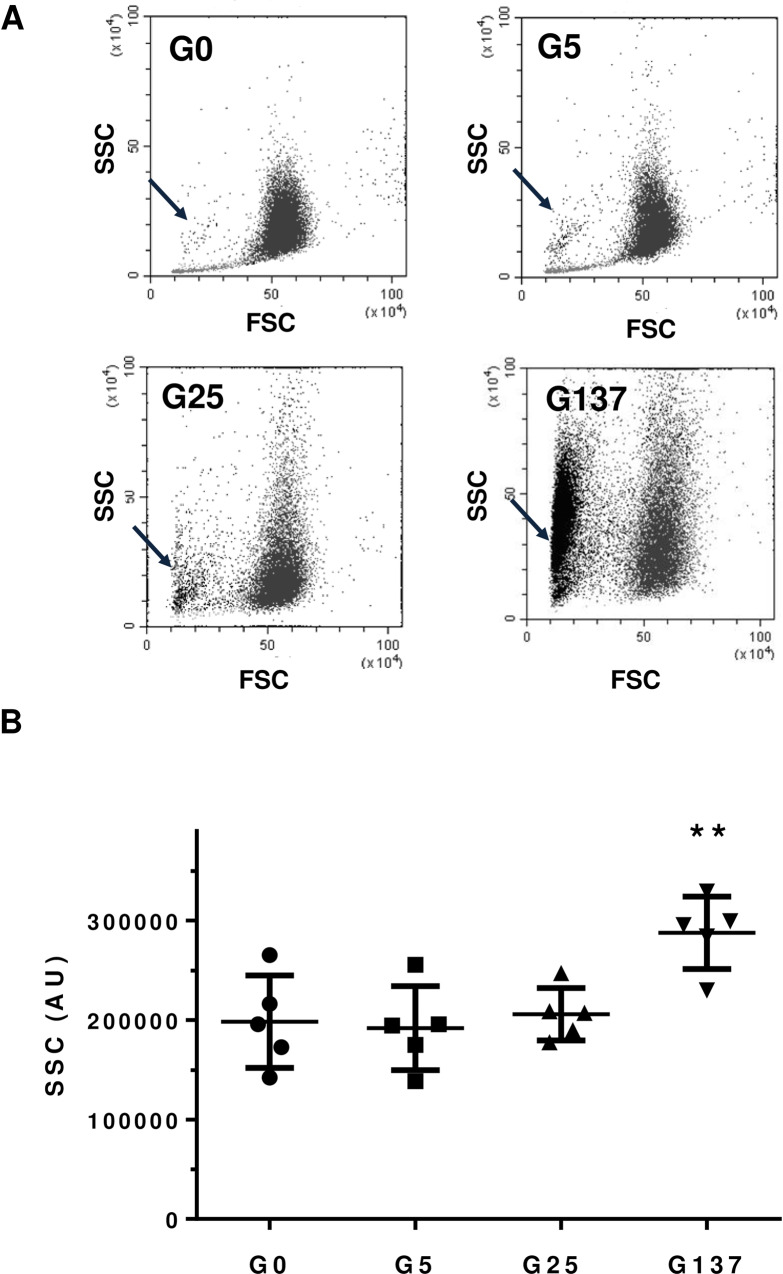
Fig 3. Glycation alters erythrocyte morphology.
Cytometry analysis of our erythrocytes preparation was performed as described in material and method section. GX corresponds to erythrocytes incubated with X mM glucose and G0 corresponds to erythrocytes incubated in the absence of glucose. (A) Erythrocyte populations were gated according to cell location in a forward scatter (FSC) versus a side scatter (SSC) parameter. Black arrow evidences the specific population of glycated altered erythrocytes that become predominant when they were incubated with increasing concentrations of glucose. (B) SSC parameters of our erythrocytes preparation were performed as described in material and method section **p<0,01 indicates a significant difference vs. G0 (Student’s t test).

