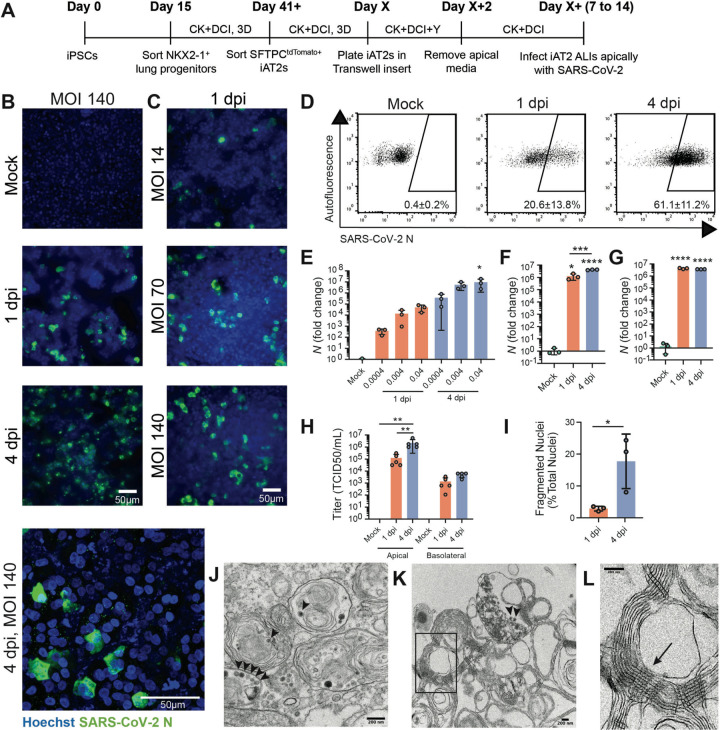
Figure 2. SARS-CoV-2 infects iAT2s in a dose- and time-dependent manner.
(A) Schematic of the iAT2 directed differentiation protocol, in which robustly self-renewing iAT2s can be plated at air-liquid interface (ALI) for SARS-CoV-2 infections. “CK+DCI”=distal lung medium components detailed in the Materials and Methods. (B) Immunofluorescence images of viral nucleoprotein (N, green) of iAT2s infected with SARS-CoV-2 (MOI=140) at 1 and 4 days post infection (dpi), or (C) with increasing MOIs (14, 70, 140) shown at 1 dpi (20x, scale bar = 50μm). (D) Efficiency of iAT2 infections scored by representative FACS plots of SARS-CoV-2 N at 1 and 4 dpi (MOI 140) compared to mock; mean gated percentages +/− standard deviation for n=3 replicates are shown. (E) RT-qPCR of viral N gene expression at 1 and 4 dpi using a range of low MOIs of an unpurified SARS-CoV-2 virus stock, n=3. (F, G) RT-qPCR of N gene expression at 1 and 4 dpi using a purified virus stock to infect with an MOI of 10 (F) or an MOI of 140 (G), n=3. Fold change expression compared to Mock [2−ΔΔCt] after 18S normalization is shown. (H) Viral titers were determined in apical washes and basolateral media at 1 and 4 dpi (n=5). (I) Mean percent fragmented nuclei in immunofluorescence images of infected iAT2s at 1 and 4 dpi (MOI 140; n=3). (J) Electron micrograph of infected iAT2s showing virions (arrow heads) intracellularly, including in a lamellar body and (K) extracellular virions around tubular myelin, the meshwork (L, arrow) that forms upon secretion of pulmonary surfactant (size bar=200 nm). All bars represent mean +/− standard deviation with biological replicates indicated for each panel. *p<0.05, **p<0.01, ***p<0.001, ****p<0.0001, unpaired, two-tailed Student’s t-test (H) or one-way ANOVA with multiple comparisons (E, F, G, H) were performed.

