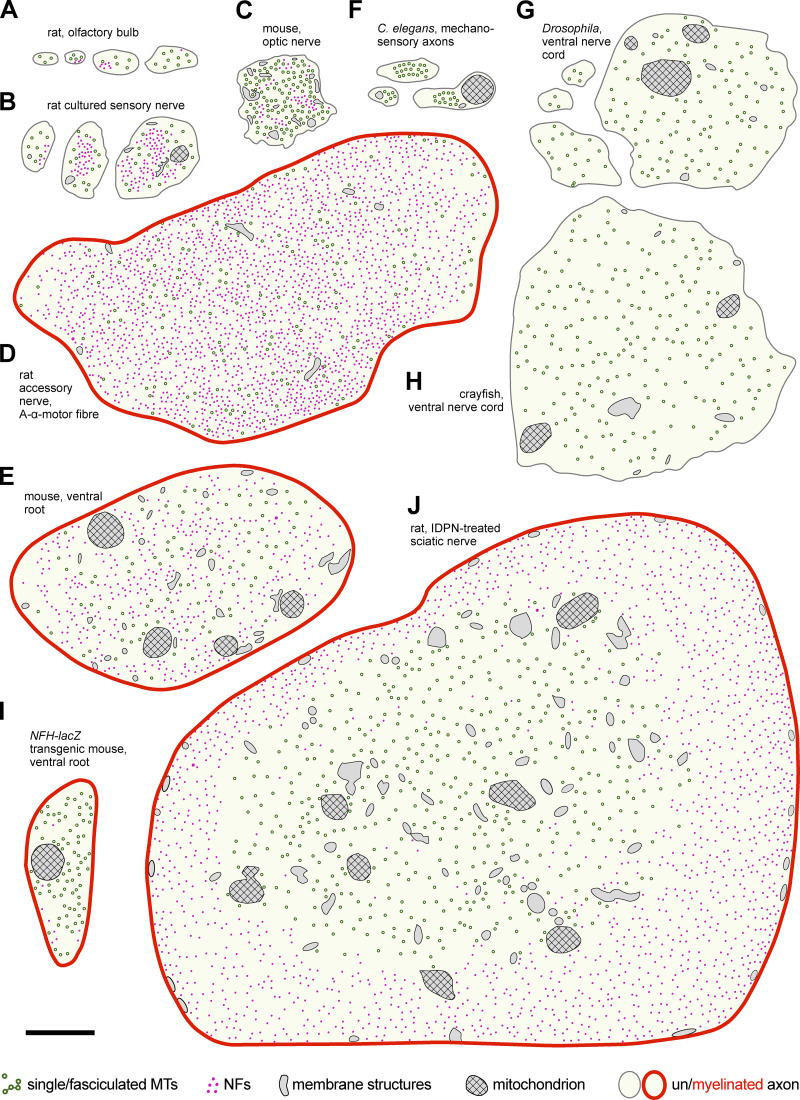
Figure 4.
MT and NF distributions in axon shafts of neurons in mammals, C. elegans, and arthropods. Images represent axons in different animals, either wild type or genetically/pharmacologically manipulated, as indicated; they were drawn from Andres, 1965a (A); Bray and Bunge, 1981 (B); Nixon et al., 1994 (C); Zenker and Hohberg, 1973 (D); Eyer and Peterson, 1994 (E and I); Chalfie and Thomson, 1979 (F); Egger et al., 1997 (G); Ochs and Burton, 1980 (H); and Papasozomenos et al., 1981 (J). Best guesses were made with respect to structures shown. Abbreviations used: IDPN, β,β'-iminodipropionitrile; NFH-lacZ, lacZ knock-in into the heavy polypeptide NF gene. Scales in most original photos were given as magnifications (unfortunately meaningless in PDF format) and were estimated here by measuring MT diameters; suggested scale bar represents 500 nm throughout.

