Figure 5.
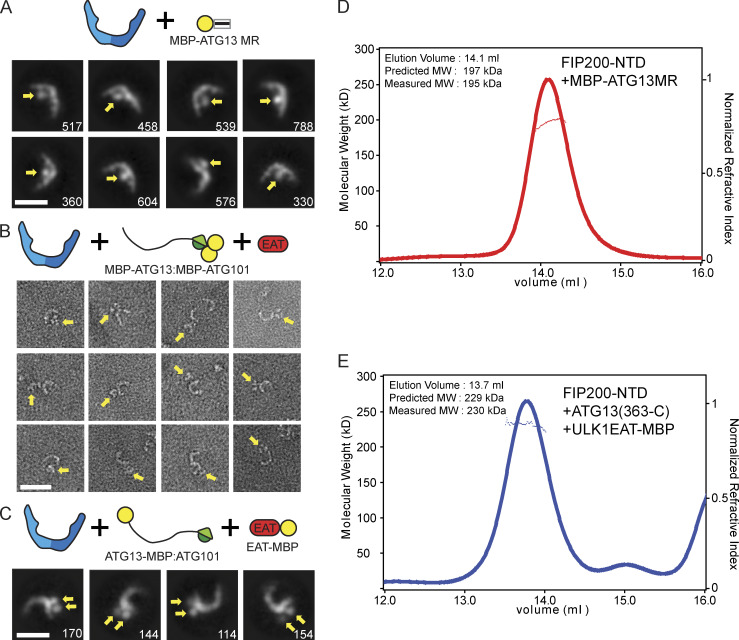
The ULK complex has unequal subunit stoichiometry. (A) Negative stain 2D class averages of FIP200NTD:MBP-ATG13MR complex. Densities corresponding to MBP tags are labeled with yellow arrows. Scale bar is 20 nm. (B) Single particles of FIP200NTD:MBP-ATG13:MBP-ATG101:ULK1 EAT complex. Density for dual MBP-tagged HORMA domains is highlighted with yellow arrows. Scale bar is 20 nm. (C) 2D class averages of FIP200NTD:ATG13-MBP:ATG101:ULK1 EAT–MBP complex. Densities corresponding to MBP tags are labeled with yellow arrows. Scale bar is 20 nm. (D and E) MALS traces for FIP200NTD:MBP-ATG13MR (D) and FIP200NTD:ATG13(363-C):ULK1 EAT–MBP (E). MW, molecular weight.

