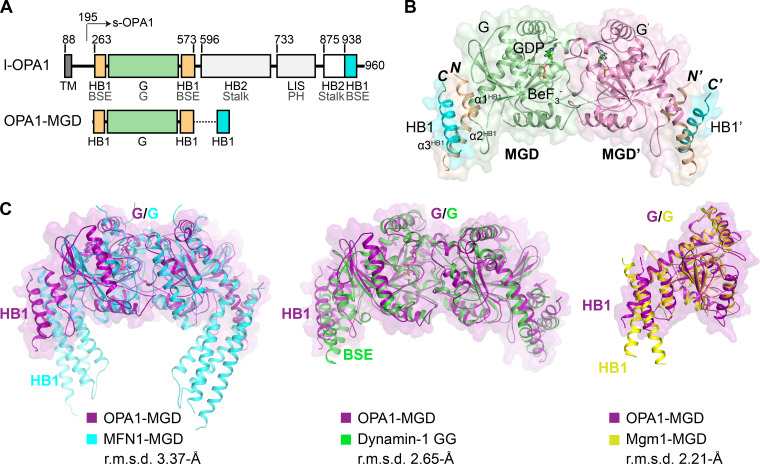
Figure 1.
Crystal structure of OPA1-MGD. (A) Scheme showing the domains of human OPA1 and the MGD construct used for crystallization. Regions of OPA1 are colored and the residues numbered. Domains of OPA1 are labeled in black, with their corresponding domains in dynamin-1 in gray for comparison. HB1-forming helices that are connected to the GTPase are colored in yellow, the GTPase in green, and the C-terminal helices that complement HB1 and HB2 in cyan. TM, transmembrane domain; BSE, bundle signaling element; LIS, lipid-interacting stalk. (B) Structure of the GDP-BeF3−-bound form of OPA1-MGD. Regions of OPA1 are colored as in A, except the G domain in the pairing molecule is colored purple. Termini are labeled in italics, and helices in the HB1 domain are numbered. Components in the pairing protomer are tagged with prime (′). A cartoon representation is shown with an overlaid surface view. (C) Superposition of OPA1-MGD with other DLPs. OPA1 is colored in magenta, MFN1 in cyan (PDB accession no. 5YEW), dynamin-1 in green (PDB accession no. 2X2F), and Mgm1 in yellow (PDB accession no. 6JSJ). Major domains are labeled. A surface representation of OPA1 is shown in all panels. The root mean squared deviation (r.m.s.d.) measurements are indicated.

