Figure 3.
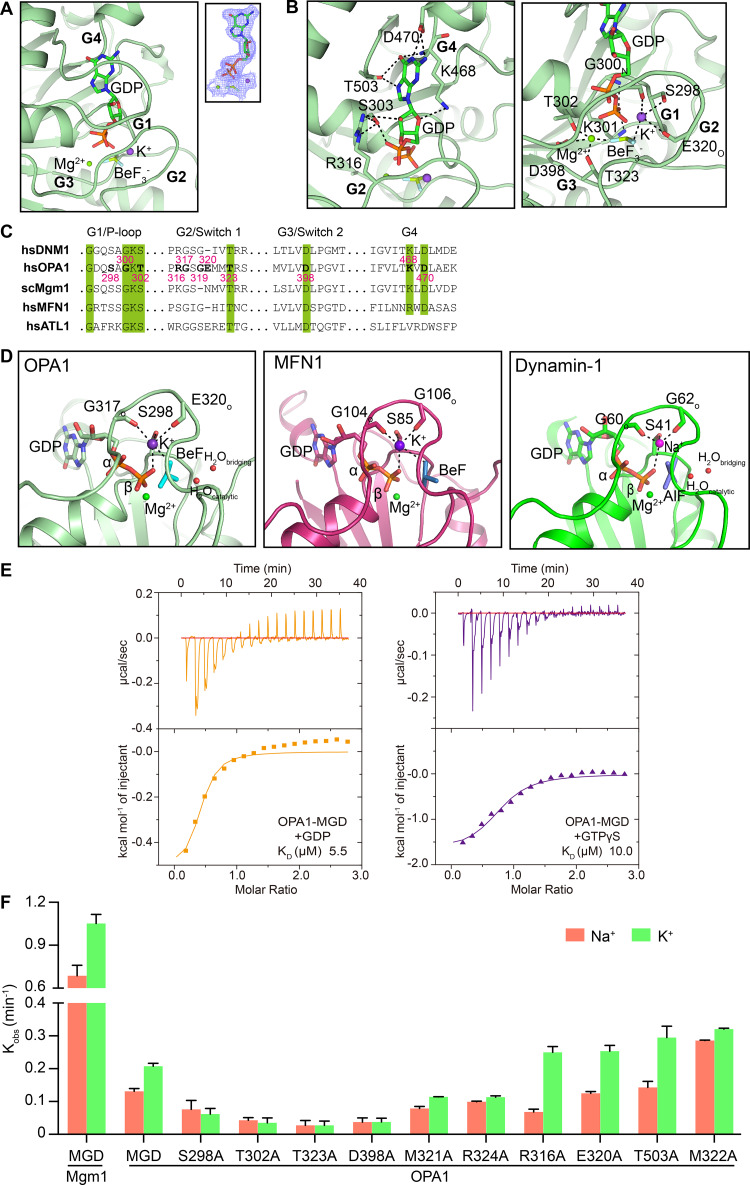
Nucleotide binding and GTP hydrolysis of OPA1. (A) GDP-BeF3− in the active site of OPA1 is shown in stick form. The 2Fo - Fc electron density maps (1.0σ contour) of GDP are shown as wire mesh (blue). (B) Interactions in the catalytic core. (C) Sequence alignment of the signature motifs of OPA1 and similar DLPs. (D) Comparison of the active sites of OPA1, MFN1 (PDB accession no. 5YEW), and dynamin-1 (PDB accession no. 2X2F). (E) Binding affinity of GDP and GTPγS for OPA1-MGD was measured by ITC in the buffer containing 150 mM KCl. A 2 mM nucleotide solution was titrated stepwise into 0.15 mM protein. The dissociation constant (KD) is given in the inset. The data are representative of at least three repetitions. (F) The GTPase activity of various OPA1 constructs was measured in the presence of 250 mM NaCl or KCl and 4 mM MgCl2. For Mgm1, the measurement was performed in buffer containing 500 mM NaCl or KCl and 5 mM MgCl2. 10 µM of protein was used for each sample. GTP hydrolysis was measured by phosphate release at saturating GTP concentrations (1 mM). Data are presented as the mean ± SD of three measurements and representative of at least three repetitions.

