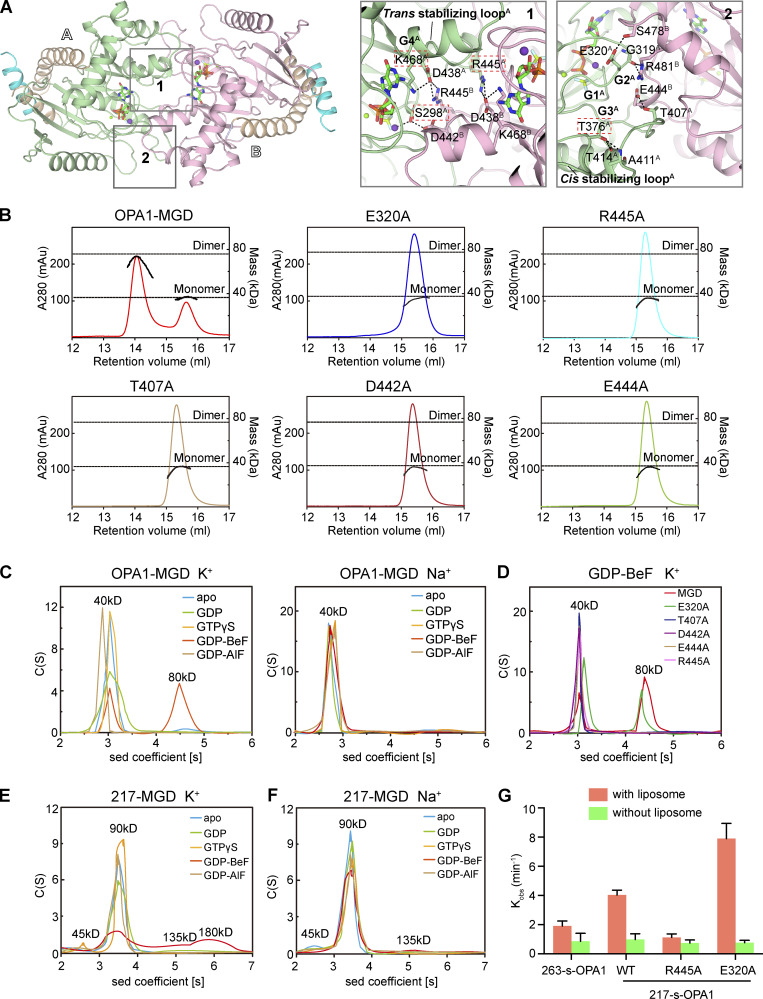
Figure 4.
Dimerization of OPA1. (A) Dimer interface of OPA1-MGD. Key regions are boxed, and a stick representation of key residues is shown. The two protomers are labeled as A and B. (B) The sizes of WT OPA1-MGD and mutants (theoretical molecular mass 39 kD) were determined by MALS coupled with gel filtration in the presence of 0.5 mM GDP and 2.5 mM BeF3− with running buffer containing 150 mM KCl and 4 mM MgCl2. The estimated molecular masses are shown on the right axis. mAu, milli-Absorbance Unit. The data are representative of at least three repetitions. (C) The size of OPA1-MGD was determined at 25 µM by AUC in the absence or presence of the indicated nucleotides in a buffer containing 150 mM KCl or NaCl. The estimated molecular masses are given above the peaks (in kilodaltons). Sed, sedimentation. The data are representative of at least three repetitions. (D) As in C, but with the indicated mutants of OPA1-MGD (theoretical molecular mass, 39 kD) in the presence of 0.5 mM GDP and 2.5 mM BeF3− in running buffer containing 150 mM KCl and 4 mM MgCl2. The data are representative of at least three repetitions. (E) As in C, but with 217-MGD (theoretical molecular mass 44.6 kD). The data are representative of at least three repetitions. (F) As in E, but in Na+-containing buffer. (G) The GTPase activity of the indicated OPA1 proteins was measured in the absence or presence of 0.2 mM IMM mimicking liposomes (47:23.5:20:8:1.5 mol % POPC/POPE/cardiolipin/soy-PI/Rhodamine-PE). 2 µM protein was incubated and 1 µM used for measurements. GTP hydrolysis was measured by phosphate release at saturating GTP concentrations (1 mM). Data are presented as the mean ± SD of three measurements and representative of at least three repetitions.

