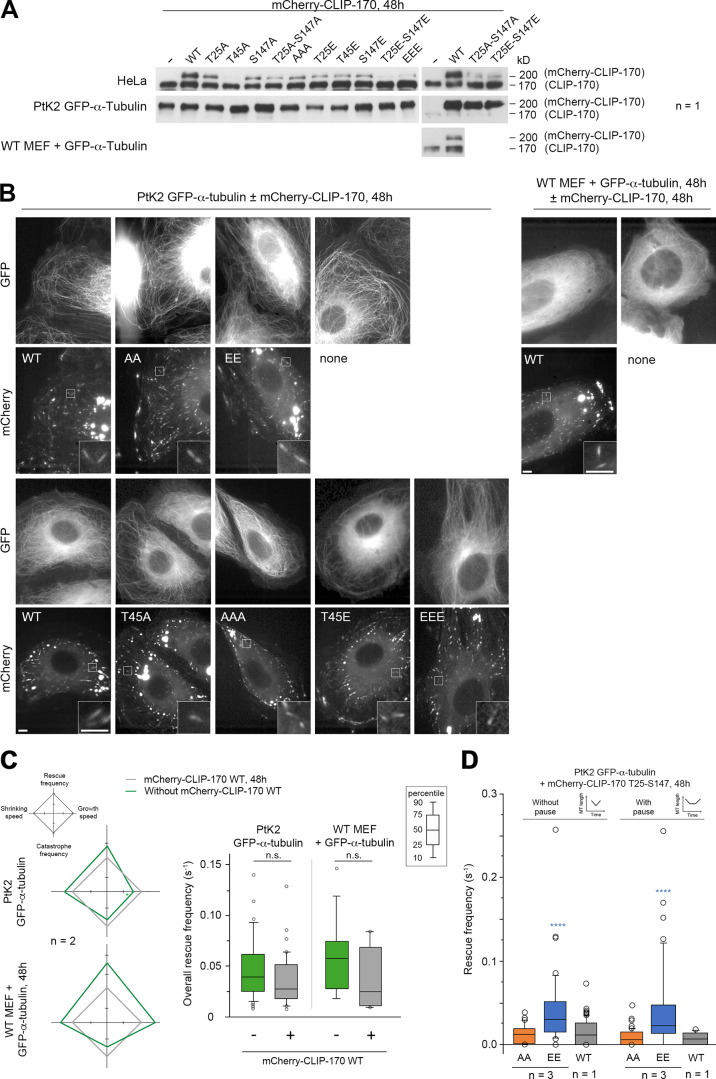
Figure S3.
mCherry–CLIP-170 expression levels used to record MT dynamics and CLIP-170 comet/remnant parameters (related to Figs. 4 and 7). (A) Western blots of CLIP-170 were performed to compare the expression levels of the endogenous CLIP-170 with that of the mCherry–CLIP-170 transgenes used in Figs. 4 and 7 and in B–D. Note that the endogenous PtK2 CLIP-170 is not well recognized by the human antibody. Since acrylamide SDS-PAGE was migrated for a long time to separate endogenous and transgenic CLIP-170, low-molecular mass proteins were lost from the gel, and this precluded the use of β-actin as loading control. (B) Sample images of the MT network (GFP–α-tubulin) and mCherry–CLIP-170 comets in living PtK2 (left panels) and MEF (right panels) cells (insets zoom on comets). mCherry–CLIP-170 patches/aggregates are due to the presence of the C-terminal Zn-finger domain of CLIP-170 and do not interfere with MT dynamics. Scale bars correspond to 5 µm. (C) MT dynamics parameters were determined from time-lapse imaging of living PtK2 cells stably expressing GFP–α-tubulin and transiently expressing or not the WT mCherry–CLIP-170 transgene. The same analysis was done in WT MEF cells transfected with GFP–α-tubulin. Diamond graphs represent mean values of MT dynamic instability parameters after normalization relative to the mCherry–CLIP-170 WT. The values of the overall rescue frequencies are reported in box plots showing representative percentiles and outliers. (D) Full-length CLIP-170 phosphomimetics increase the frequency of rescues with immediate or delayed regrowth in cells. MT dynamics parameters were determined from time-lapse imaging of living PtK2 cells stably expressing GFP-α-tubulin and transiently expressing the indicated mCherry–CLIP-170 transgenes (related to Fig. 4 B). The values of the rescue frequencies in each class are reported in box plots showing representative percentiles and outliers. The numerical mean values ± SD of each parameter are shown in C and D, but also the numbers of cells, MTs, and transitions are detailed in Table S1. The statistical comparisons were performed using one-factor ANOVA followed by Fisher's protected t tests for pairwise comparisons (Table S2). n indicates the number of independent experiments. ****, P < 0.0001. n.s., not significant.

