Figure 2.
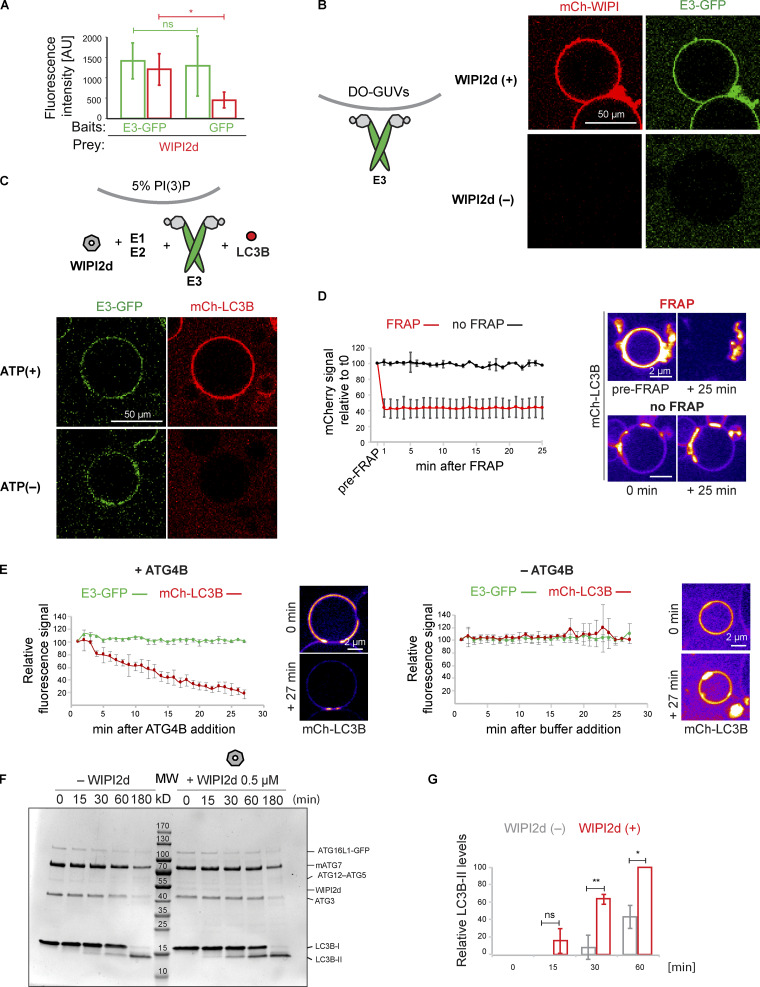
WIPI2d both recruits and allosterically activates E3 for LC3 lipidation. (A) Quantification of the mCherry-WIPI2d signal intensity (red bars) measured on GFP-Trap beads coated with either GFP or GFP-tagged E3 (means ± SD; n = 94 [E3-GFP] or 80 [GFP]). P values were calculated using Student’s t test: not significant (ns), P ≥ 0.05; *, 0.01 < P < 0.05; **, 0.001 < P < 0.01; AU, arbitrary units. (B) E3-GFP (0.5 µM) was added to DO-GUVs containing 75% PC:5% PI(3)P:20% PE in the absence or presence of mCherry-WIPI2d (0.5 µM). (C) E3-GFP (0.1 µM) was coincubated with WIPI2d (0.5 µM), mCherry-LC3B, and the lipidation machinery on DO-GUVs [75% PC:5% PI(3)P:20% PE] in the presence of MgCl2/ATP. (D) FRAP experiment on GUVs after lipidation in the presence of ATP as conducted in (C). A quantification is shown (means ± SD; n FRAP = 3, n no FRAP = 2), together with representative images of the two conditions, at times 0 and 25 min after the photobleaching. (E) De-lipidation reactions on GUVs treated as in (C), in the presence of ATP. CIP/ATG4B (left) or buffer (right) was added to the wells, and imaging was conducted for the indicated time. Quantification of the mCherry-LC3B and E3-GFP signals over time is shown (means ± SD; n CIP/ATG4B = 31, n buffer = 6), together with representative images of the two conditions, at times 0 and 27 min after the addition. (F) In vitro LC3B lipidation assay on DO-SUVs in the absence or presence of WIPI2d. ATG7, ATG3, E3-GFP (0.1 µM), and LC3B are mixed with DO-SUVs [75% PC:5% PI(3)P:20% PE], either in the absence (left) or in the presence of 0.5 µM WIPI2d (right), and incubated at 37°C with MgCl2/ATP. Samples were taken at the indicated time points and loaded on a 4–15% SDS-polyacrylamide gel. MW, molecular weight. (G) Quantification of three independent experiments is shown as relative LC3B-II levels at each time point (means ± SD; n = 3). ns, not significant.

