Figure 2.
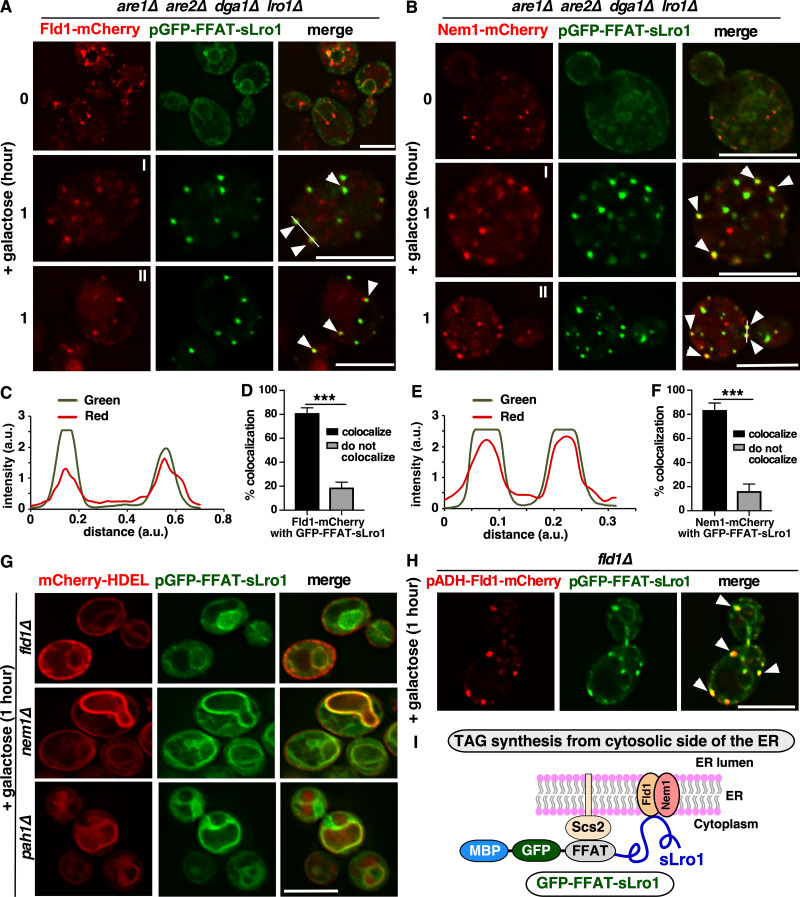
Fld1 and Nem1 define ER subdomains for the recruitment of the TAG-synthase. (A and B) 4ΔKO cells expressing Fld1-mCherry (A) or Nem1-mCherry (B) together with GFP-FFAT-sLro1 from a galactose-inducible promoter. Fld1-mCherry (A) and Nem1-mCherry (B) show punctate localization in the absence of LDs (0 h). Upon 1 h of induction, GFP-FFAT-sLro1 colocalizes with Fld1-mCherry (A) or Nem1-mCherry (B). White arrowheads indicate colocalization of sLro1 with Fld1 (A) and Nem1 (B), respectively. Two examples of the 1 h time points are shown (I, II) for A and B. Scale bars, 5 µm. (C and E) Line scan of signal intensity along the white line shown in A (I) and B (II), respectively. (D and F) Quantification of colocalization between Fld1 (D) and Nem1 (F) punctae with sLro1. Data are means ± SD, n > 50 cells; ***, P < 0.0005. (G) Fld1, Nem1, and Pah1 are required to recruit the TAG-synthase into discrete ER foci. Cells lacking Fld1, Nem1, or Pah1 expressing GFP-FFAT-sLro1 and coexpressing mCherry-HDEL to mark the ER. Scale bar, 5 µm. (H) Overexpression of Fld1 in fld1Δ cells creates ER sites that recruit GFP-FFAT-sLro1. Fluorescence microscopy of fld1Δ cells harboring Fld1-mCherry and coexpressing GFP-FFAT-sLro1. White arrowheads denote colocalization between Fld1 and sLro1. Scale bar, 5 µm. (I) Cartoon showing the recruitment of sLro1 at Fld1 and Nem1 sites.

