Figure 3.
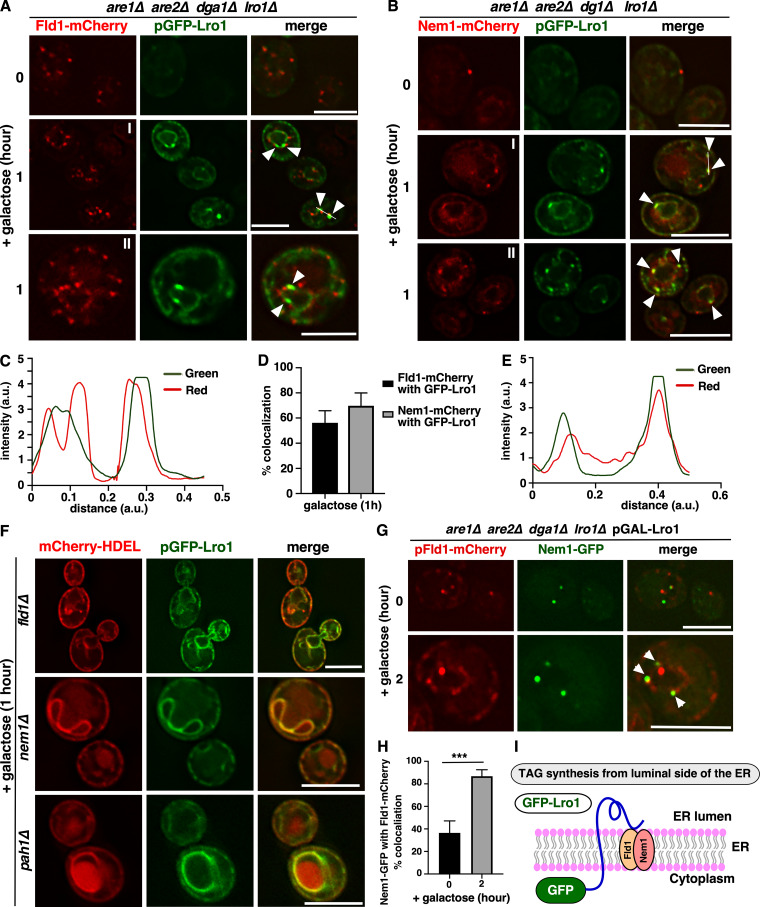
ER sites marked by Fld1 and Nem1 recruit native Lro1. (A and B) ER subdomains marked by Fld1 and Nem1 recruit native Lro1. 4ΔKO cells expressing Fld1-mCherry (A) or Nem1-mCherry (B) and coexpressing native GFP-Lro1 from a galactose-inducible promoter. Cells show punctate distribution of Fld1-mCherry and Nem1-mCherry (0 h). Upon induction, GFP-Lro1 colocalizes with Fld1-mCherry and Nem1-mCherry (1 h). White arrowheads indicate colocalization of Lro1 with Fld1 (A) and Nem1 (B), respectively. Two examples of the 1 h time points are shown (I, II) for A and B. Scale bars, 5 µm. (C and E) Line trace of signal intensity along the white line shown in A (I) and B (I), respectively. (D) Quantification of colocalization between Fld1 or Nem1 foci with Lro1. Data are means ± SD, n > 50 cells; **, P < 0.005. (F) Cells missing Fld1, Nem1, or Pah1 fail to recruit GFP-Lro1 into discrete foci. Cells expressing native GFP-Lro1 and coexpressing mCherry-HDEL to mark the ER were cultured in galactose-containing media for 1 h. Scale bars, 5 µm. (G and H) Colocalization between Fld1 and Nem1 during LD biogenesis. 4ΔKO cells expressing genomic Nem1-GFP and coexpressing Fld1-mCherry under a constitutive ADH1 promoter, together with Lro1. Colocalization between Nem1 and Fld1 denoted by white arrowheads (G) was quantified after galactose induction of Lro1 for 2 h (H). Data are means ± SD, n > 50 cells; ***, P < 0.0005. Scale bars, 5 µm. (I) Cartoon illustrating recruitment of native Lro1 at Fld1 and Nem1 sites.

