Figure 6.
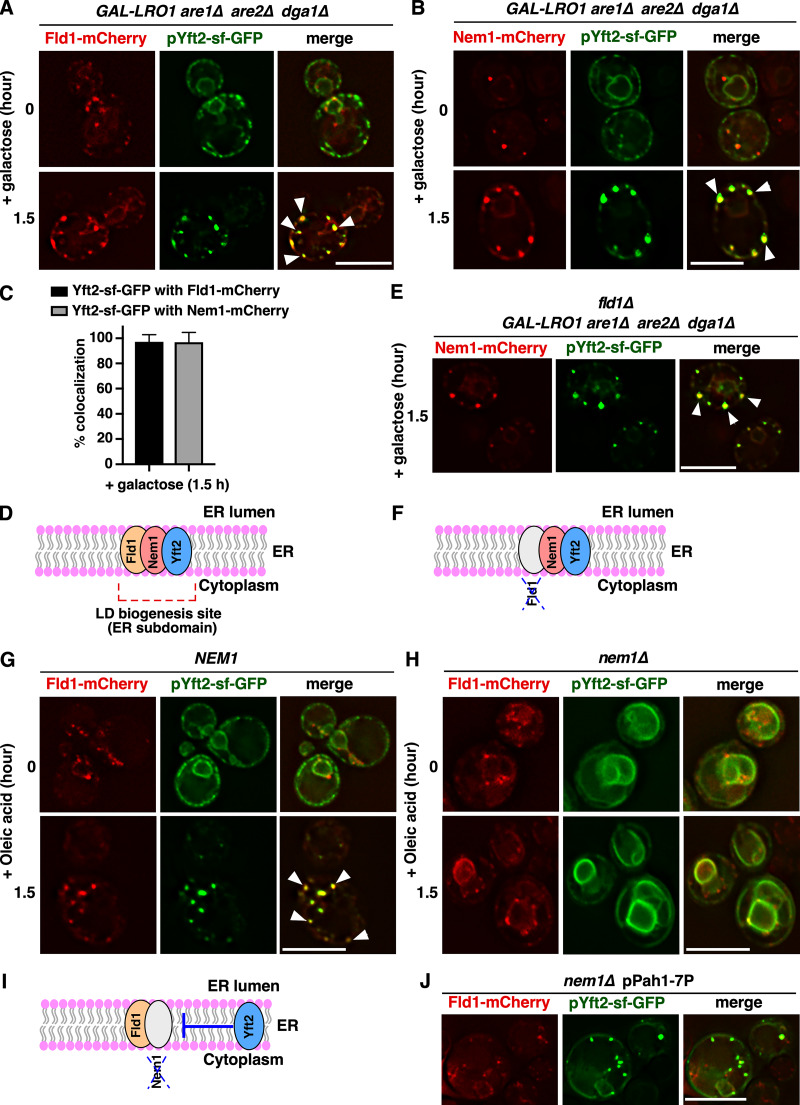
ER subdomains marked by Fld1 and Nem1 recruit Yft2. (A and B) Yft2 concentrates at Fld1- and Nem1-containing ER sites. 3ΔKO cells expressing Fld1-mCherry (A) or Nem1-mCherry (B) and coexpressing Yft2-sf-GFP were transferred to galactose media. White arrowheads indicate colocalization of Yft2 with Fld1 (A) or Nem1 (B). (C) Quantification of colocalization of Yft2 with Fld1 and Nem1. Data are means ± SD, n > 50 cells. (D) Cartoon depicting ER subdomain containing Fld1, Nem1, and Yft2. (E) Localization of Yft2 at Nem1 sites is independent of Fld1. fld1Δ 3ΔKO cells expressing Nem1-mCherry and coexpressing Yft2-sf-GFP were grown as described in A. White arrowheads indicate colocalization of Yft2 with Nem1. (F) Cartoon showing that the colocalization of Yft2 with Nem1 is independent of Fld1. (G and H) Yft2 requires Nem1 at sites of LD biogenesis. NEM1 (G) and nem1Δ (H) cells expressing Fld1-mCherry and coexpressing Yft2-sf-GFP were grown in SC media, resuspended into fresh media containing 0.1% OA, and visualized after 1.5 h. White arrowheads denote colocalization of Yft2 with Fld1 foci in G. Scale bar, 5 µm. (I) Cartoon depicting colocalization between Yft2 and Fld1 is dependent on Nem1. (J) DAG levels affect the localization of Yft2 and Fld1. nem1Δ cells expressing Fld1-mCherry, Yft2-sf-GFP, and coexpressing Pah1-7P were grown to early stationary phase in SC media. White arrowheads denote colocalization of Yft2 with Fld1 foci. Scale bar, 5 µm.

