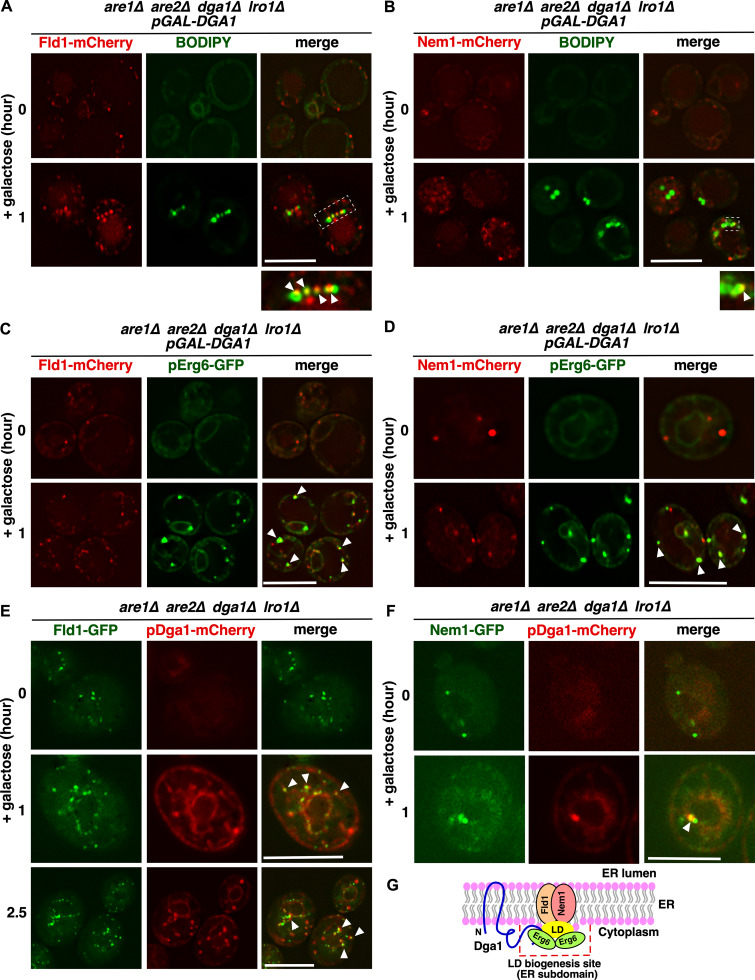
Figure S5.
Induction of TAG-synthase Dga1 results in LD formation at Fld1 and Nem1 sites. (A and B) Fld1 and Nem1 sites are stained with BODIPY upon TAG synthesis. 4ΔKO cells expressing Fld1-mCherry (A) or Nem1-mCherry (B) and coexpressing Dga1 from a galactose-inducible promoter were switched to galactose media for 1 h and stained with BODIPY. White arrowheads indicate colocalization between BODIPY and Fld1/Nem1 punctae. Scale bars, 5 µm. (C and D) ER subdomains marked by Fld1 and Nem1 become enriched with LD marker protein. 4ΔKO cells expressing Fld1-mCherry (C) or Nem1-mCherry (D), Erg6-GFP, and coexpressing Dga1 from a galactose-inducible promoter were grown as described in A. White arrowheads indicate colocalization between Erg6 and Fld1/Nem1 punctae. Scale bars, 5 µm. (E and F) Dga1 colocalizes with Fld1/Nem1 sites. 4ΔKO cells expressing Fld1-GFP (E) or Nem1-GFP (F) and coexpressing Dga1-mCherry from a galactose-inducible promoter were switched to galactose for the indicated time. White arrowheads denote colocalization between Dga1-mCherry and Fld1-GFP/Nem1-GFP punctae. Scale bars, 5 µm. (G) Cartoon illustrating the recruitment of Dga1-mCherry to Fld1 and Nem1 ER sites, where droplets begin to form.

