Figure 2.
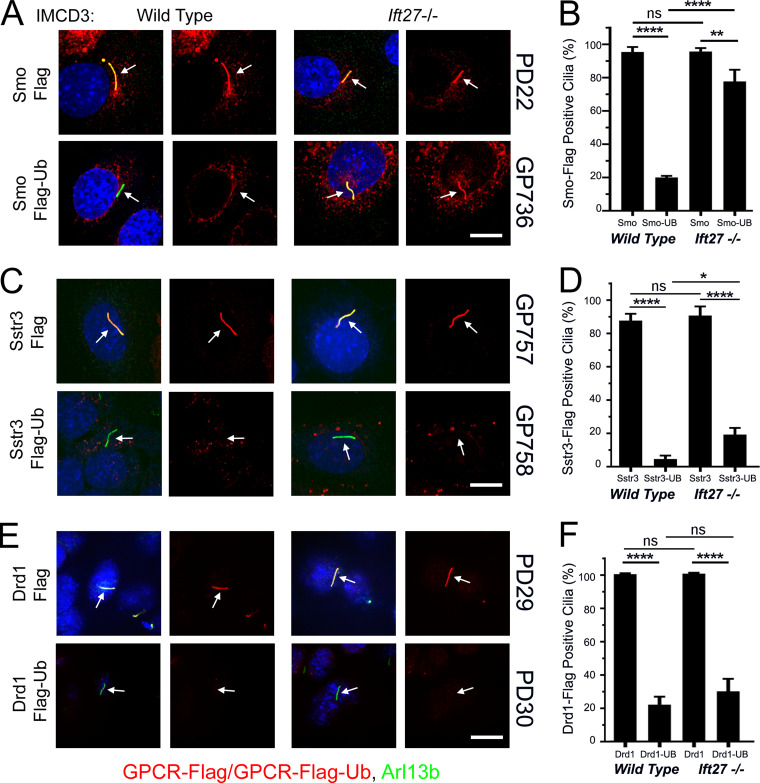
GPCR trafficking in IMCD3 cells reveals diversity in ciliary retrieval mechanisms. (A) Wild-type and Ift27 mutant IMCD3 cells were transfected with PD22 (Smo-Flag) or GP736 (Smo-Flag-Ub) and selected with Bsd. Confluent cells were serum starved for 48 h before being fixed and stained for Smo or Smo-Ub (Flag; red), cilia (Arl13b; green; arrows), and nuclei (DAPI; blue). Each image is maximum projection of a three-image stack taken at 0.2-μm intervals. Left image of each pair is a three-color composite; right image shows only the red Flag channel. Scale bar is 10 μm and applies to all images in the panel. (B) Presence of ciliary Smo or Smo-Ub was quantitated from cells in A. N is 3 replicates with at least 100 cells counted per condition. ****, P < 0.0001; **, P < 0.01; ns, not significant by two-way ANOVA. Error bars indicate SD. (C) Wild-type and Ift27 mutant IMCD3 cells were transfected with GP757 (Sstr3-Flag) or GP758 (Sstr3-Flag-Ub) and selected with Bsd. Confluent cells were serum starved for 48 h before being fixed and stained for Sstr3 or Sstr3-Ub (Flag; red), cilia (Arl13b; green; arrows), and nuclei (DAPI; blue). Each image is maximum projection of a three-image stack taken at 0.2-μm intervals. Left image of each pair is a three-color composite; right image shows only the red Flag channel. Scale bar is 10 μm and applies to all images in the panel. (D) Presence of ciliary Sstr3 or Sstr3-Ub was quantitated from cells in C. N is 3 replicates with at least 100 cells counted per condition. ****, P < 0.0001; *, P < 0.05; ns, not significant by two-way ANOVA. Error bars indicate SD. (E) Wild-type and Ift27 mutant IMCD3 cells were transfected with PD29 (Drd1-Flag) or PD30 (Drd1-Flag-Ub) and selected with Bsd. Confluent cells were serum starved for 48 h before being fixed and stained for Drd1 or Drd1-Ub (Flag; red), cilia (Arl13b; green; arrows), and nuclei (DAPI; blue). Each image is maximum projection of a three-image stack taken at 0.2-μm intervals. Left image of each pair is a three-color composite; right image shows only the red Flag channel. Scale bar is 10 μm and applies to all images in the panel. (F) Presence of ciliary Drd1 or Drd1-Ub was quantitated from cells in C. N is 3 replicates with at least 100 cells counted per condition. ****, P < 0.0001; ns, not significant by two-way ANOVA. Error bars indicate SD.

