Figure 4.
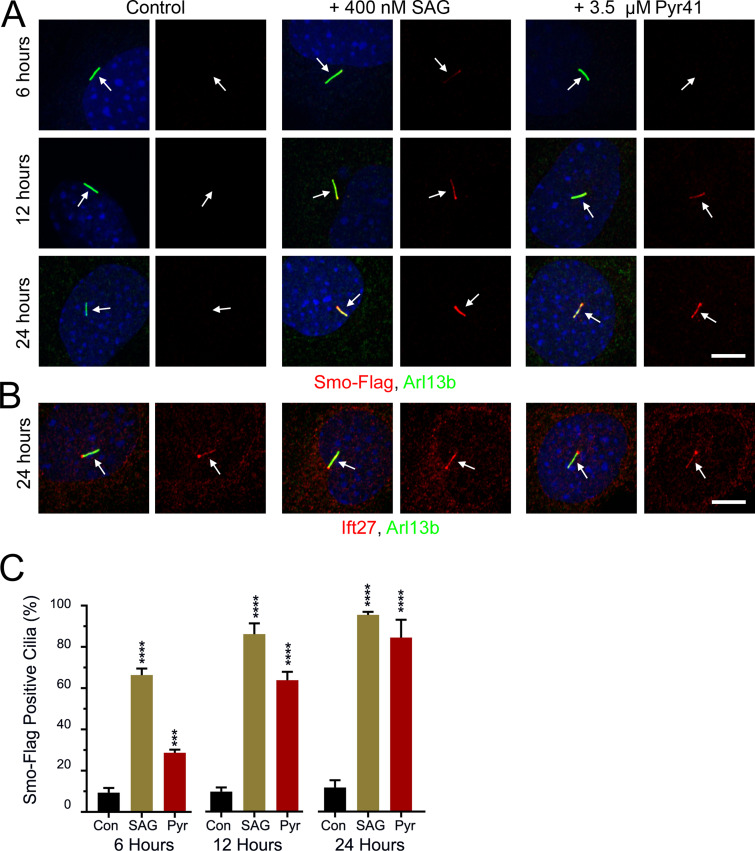
E1 inhibition elevates ciliary Smo levels. (A) Wild-type MEFs were transfected with Smo-Flag (PD22), and a single-cell clone (11479.6T PD22 Clone3) was selected that showed low ciliary Smo-Flag at the basal level and high ciliary Smo-Flag after SAG stimulation. These cells were serum starved and not treated (Con), treated with 400 nM SAG (SAG), or treated with 3.5 µM Pyr41 (Pyr). Coverslips were removed at the indicated times, fixed, and stained for Smo (Flag; red), cilia (Arl13b; green; arrows), and nuclei (DAPI; blue). Scale bar is 10 μm and applies to all images. Each image is maximum projection of a three-image stack taken at 0.2-μm intervals. Left image of each pair is a three-color composite; right image shows only the red Flag channel. (B) Cells described in A were fixed at 24 h and stained for Ift27 (red), cilia (Arl13b; green; arrows), and nuclei (DAPI; blue). Scale bar is 10 μm and applies to all images. Each image is maximum projection of a three-image stack taken at 0.2-μm intervals. Left image of each pair is a three-color composite; right image shows only the red Ift27 channel. (C) Presence of ciliary Smo-Flag was quantitated from cells in A. N is 3 replicates with at least 100 cells counted per condition. ***, P < 0.001; ****, P < 0.0001 compared with control at each time point by one-way ANOVA. Error bars indicate SD.

