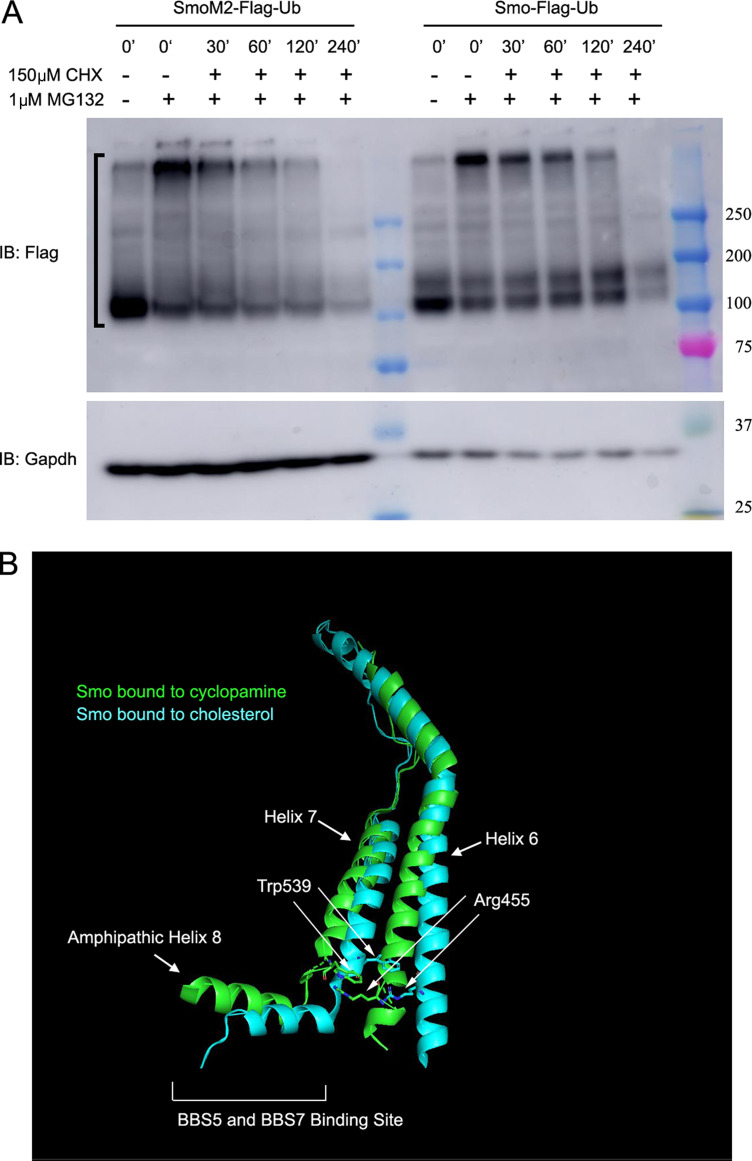
Figure S3.
Related to Fig. 3: Structure of Smo. (A) MEF cells expressing either SmoM2-Flag-Ub or Smo-Flag-Ub were treated with (+) or without (−) 1 μM MG132 for 4 h. After 4 h, 0-min time points were collected, the MG132 was washed out, and 150 μM cycloheximide was added to the remaining cells. Samples were then collected at 30, 60, 120, and 240 min after the removal of MG132 and the addition of cycloheximide. The half-life of Smo-Flag-Ub and SmoM2-Ub was 110 min and 181 min, respectively (N is 2 replicates). Bracket marks the region of the gel that was used to calculate Smo decay. IB, immunoblot. (B) Ribbon diagram of Smo showing the location of SmoM2 (W539) in transmembrane 7 and SmoPi (R455) residues in transmembrane 6 (redrawn by Pymol [PyMOL.org] from data in Huang et al., (2018). Blue green is cholesterol-bound human Smo (5L7I; Byrne et al., 2016), and green is cyclopamine-bound Xenopus Smo (6D32; Huang et al., 2018). The two states predict the transitions from inactive (blue green) to active (green) when the Pi bond is broken. The breaking of the Pi bond is accompanied by shifts in the position of transmembrane helixes 6 and 7 and amphipathic helix 8, which is the proposed binding site of BBS5 and BBS7 (Seo et al., 2011).

