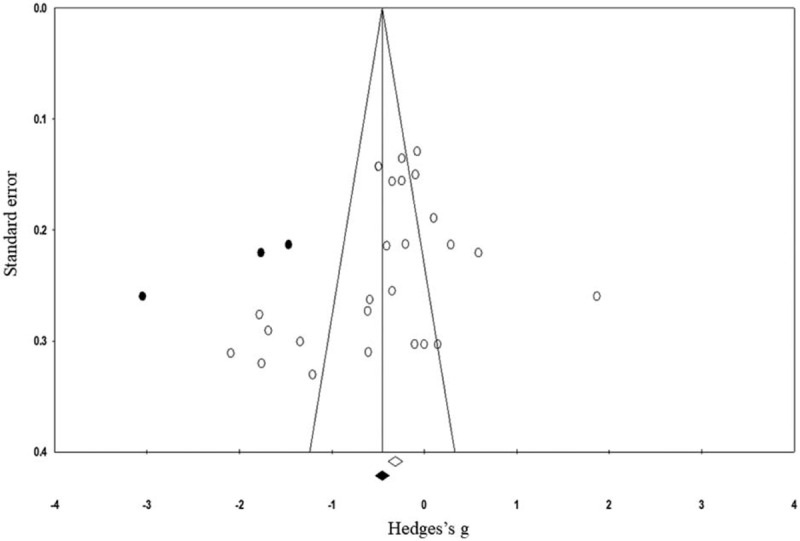
Figure 4.

Illustrates the publication bias funnel plot by the Duval and Tweedie trim and fill procedure. Each of the analyzed effect is denoted by a circle in the plot. The boundaries of the plot mark the area where 95% of all the effects reside in case there were no publication biases. The vertical midline denotes the mean standardized effect of zero.
