Figure 1.
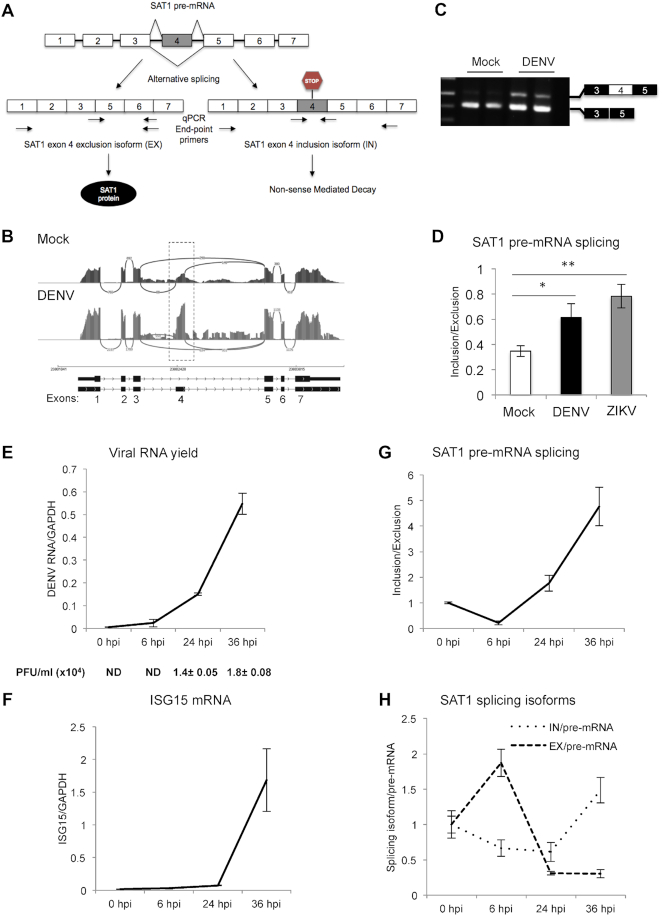
Dengue virus infection modulates SAT1 alternative splicing. (A) Diagram of SAT1 pre-mRNA splicing giving rise to two different splicing isoforms, a protein coding (EX isoform) and a non-coding one (IN isoform). Arrows indicate the position of the primer pairs used for end-point and qPCR. (B)SAT1 RNA-seq reads indicating the position of alternative 110 nt-exon 4 from mock and dengue infected A549 cells (20) at 24 h post-infection (hpi). (C) Reverse transcription followed by end-point PCR identifying SAT1 splicing isoforms by electrophoresis in agarose gel, from total RNA of A549 cells at 24 hpi. (D) Quantified SAT1 inclusion/exclusion ratio with specific primers for each splicing isoform by RT-qPCR, from total RNA of A549 cells at 24 hpi with DENV or ZIKV. (E–H) RT-qPCRs of viral RNA (E), Interferon Stimulated Gene 15 (ISG15) (F), SAT1-IN and EX isoforms (G) and SAT1-IN and EX isoforms relative to SAT1 pre-mRNA (H) from A549 cells at the indicated time points post-infection. Viral infection was also monitored by plaque formation assay (PFU: Plaque Forming Units) (E). Average values from triplicates are shown with standard deviation and p-values, determined using a paired two-tailed t-test. Significant p-values are indicated by the asterisks above the graphs (***P< 0.001; **P< 0.01; *P< 0.05).

