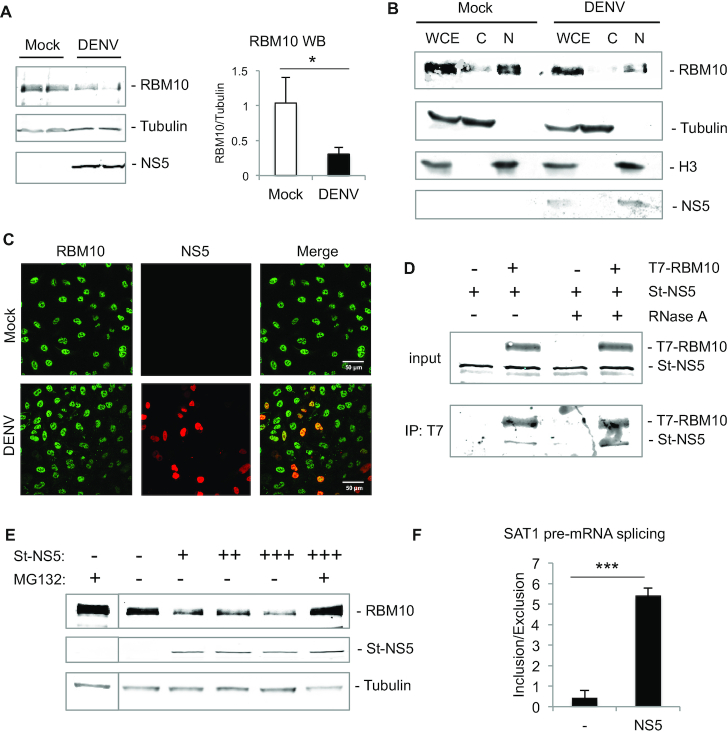
Figure 3.
DENV NS5 interacts with RBM10 and targets it for proteasomal degradation. (A) A549 cells were infected with DENV for 48 h and whole cell lysates were analyzed by western blot of RBM10, tubulin and NS5. (B) A549 cells were infected with DENV for 48 h and subjected to subcellular fractionation. Western blot of RBM10, tubulin, histone H3 and NS5 was performed from WCE: whole cell extract; C: cytoplasm and N: nucleus. (C) A549 cells were infected with DENV for 48 h and subjected to indirect immunofluorescence of RBM10 and NS5. (D) Western blot of T7-immunoprepicitated RBM10 and co-precipitated Streptag-NS5 in the absence or presence of RNase A. (E) A549 cells were transfected with empty vector or Streptag-NS5 expression vector (0.1, 0.5 and 1 μg) and treated with 2 μM MG132 for 3 h. RBM10, NS5 and tubulin levels were assessed by western blot. (F) A549 cells were transfected with empty vector or NS5 expression vector and after 48 h SAT1 inclusion/exclusion ratio was quantified by RT-qPCR. Average values from triplicates are shown with standard deviation and p-values, determined using a paired two-tailed t-test. Significant P-values are indicated by the asterisks above the graphs (***P< 0.001; **P< 0.01; *P< 0.05).

