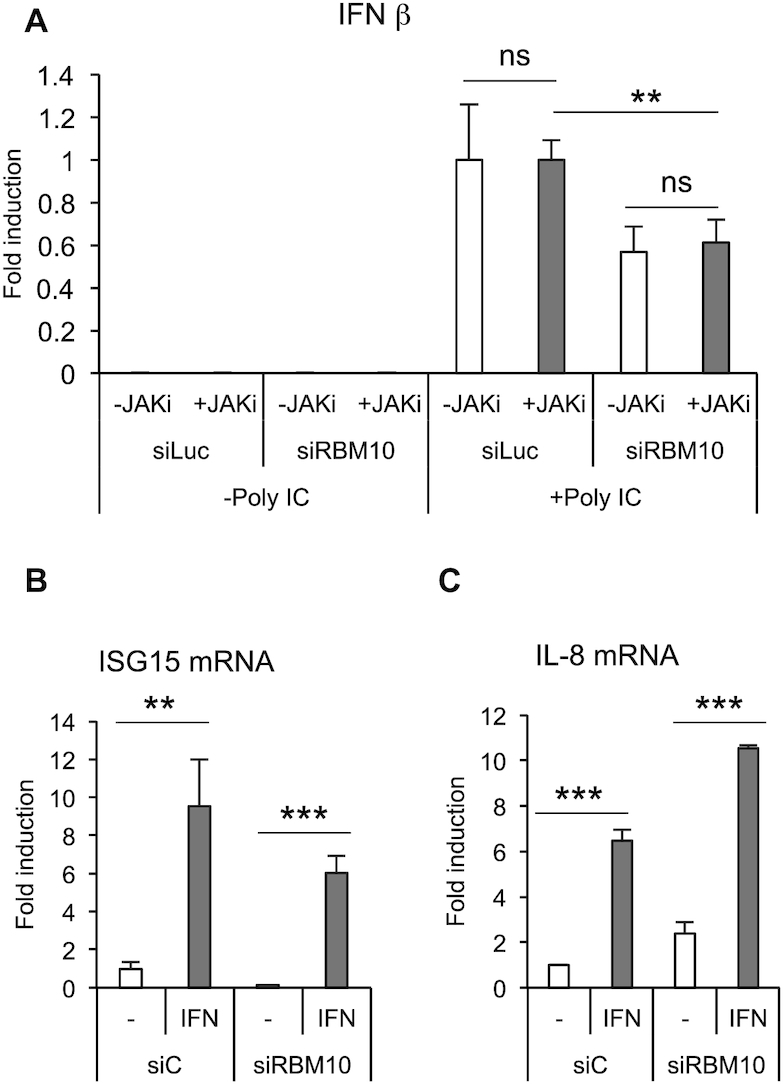
Figure 5.

RBM10 is involved in the RLR signaling pathway. (A) A549 cells were transfected with the indicated siRNAs (40 nM) for 48 h, then mock treated (DMSO) or treated with 1 μM JAK inhibitor for additional 24 h during which, the last 9 h included Poly I:C intracellular administration. RNA was prepared and analyzed by RT-qPCR for IFN β. (B and C) A549 cells were transfected with the indicated siRNAs (40 nM) for 24 h and then treated with IFN α (50 000 U/ml) for additional 24 h. ISG15 (B) and IL-8 (C) mRNA levels were analyzed by RT-qPCR. Average values from triplicates are shown with standard deviation and P-values, measured with a paired two-tailed t-test. Significant P-values are indicated by the asterisks above the graphs (***P< 0.001; **P< 0.01; *P< 0.05).
