Figure 2.
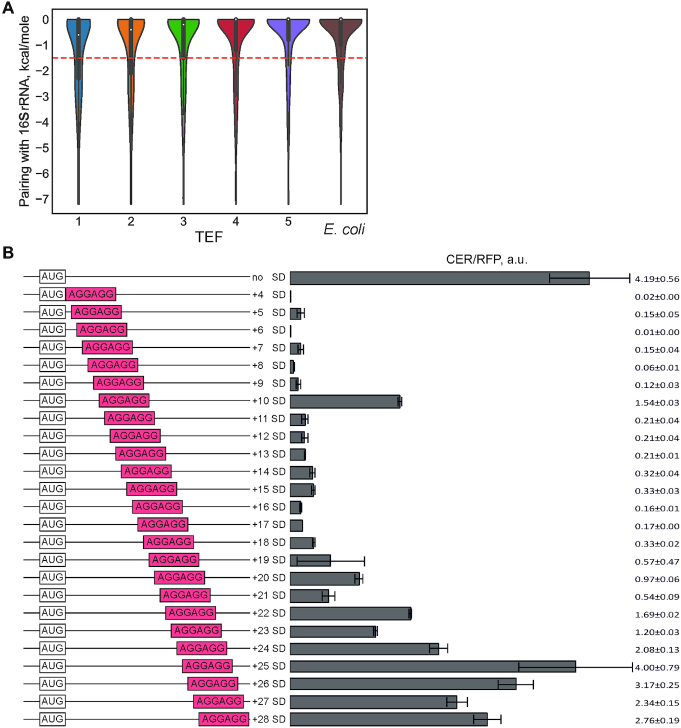
Influence of SD-like sequences in the beginning of the coding region on translation efficiency. (A) Violin plot of distributions of the energy of potential base-pairing with the 16S rRNA 3′-terminal region in five TEF and in natural E. coli genes, P-value <10−4 (random shuffling, see Methods, Statistical Analysis). Dashed line: lower quartile of the combined distribution for all TEFs. (B) Translation efficiency of the designed constructs. Schematic representation (left side of the panel) and translation efficiencies (right side of the panel) of the constructs. All constructs designations are indicated next to the schematic representations. SD-like sequences are shown in red boxes. Translation efficiencies of the CER reporter were normalized to the reference RFP construct and indicated as a diagram. Exact values are shown next to the corresponding bars. The sequences are listed in Supplementary Table S2.

