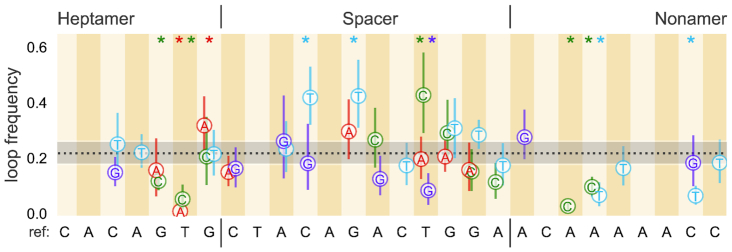
Figure 3.
Looping frequency for single bp changes introduced at various positions of the reference 12RSS. Loop frequency with 95% confidence interval of the distribution of possible looping frequencies from 106 bootstrap replicates. The dotted black line is set at the reference loop frequency, 0.22, with shaded area denoting the extent of the 95% confidence interval for the reference. Alternating vertical stripe colors and the reference sequence written along the x-axis demarcate the position where the change was made and the original nucleotide. The introduced nucleotide is provided in the figure with the letter and color-coded (red for A, green for C, light blue for T and purple for G). Heptamer, spacer and nonamer regions are also separated by vertical lines in the sequences. Asterisks at the top of certain positions are color-coded to specify the nucleotide whose resultant looping frequency differs from the reference sequence with p-value ≤ 0.05. All p-values for each 12RSS used are reported in Supplementary Figure S5.

