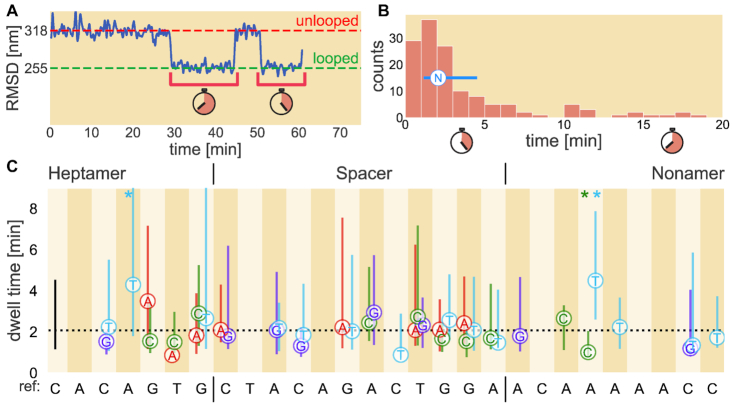
Figure 4.
Dwell time quartiles for single bp changes introduced at various positions of the reference 12RSS. (A) Example bead trajectory data (blue) and the dwell times of the two loops that are formed (brackets). As in Figure 2, the red dashed line corresponds to the unlooped DNA tether state while the green dashed line denotes the predicted looped state. (B) Histogram of all dwell times collected for a given RSS. Note that all loops involving the RSS of interest are included in the histogram, regardless of whether the loop precedes cutting or a return to the unbound state. The median is shown as the circle containing N (for nucleotide) with lines extending to the first and third quartiles. The method for obtaining the circle and error bars as shown in (B) are then applied to each synthetic 12RSS dataset and presented in (C) where the letters denote the replacement nucleotide. The dotted black line in (C) denotes the reference 12RSS median dwell time, 2.1 min, with the black bar at the left denoting the first and third quartiles of the distribution. Vertical stripes; x-axis labeling; heptamer, spacer and nonamer distinction; and color-coding of nucleotide changes (red for A, green for C, light blue for T and purple for G) are the same as in Figure 3. Asterisks at the top of certain positions are color-coded to specify the nucleotide whose resultant dwell time differs from the reference sequence with p-value ≤ 0.05. All p-values for each 12RSS used are reported in Supplementary Figure S5.

