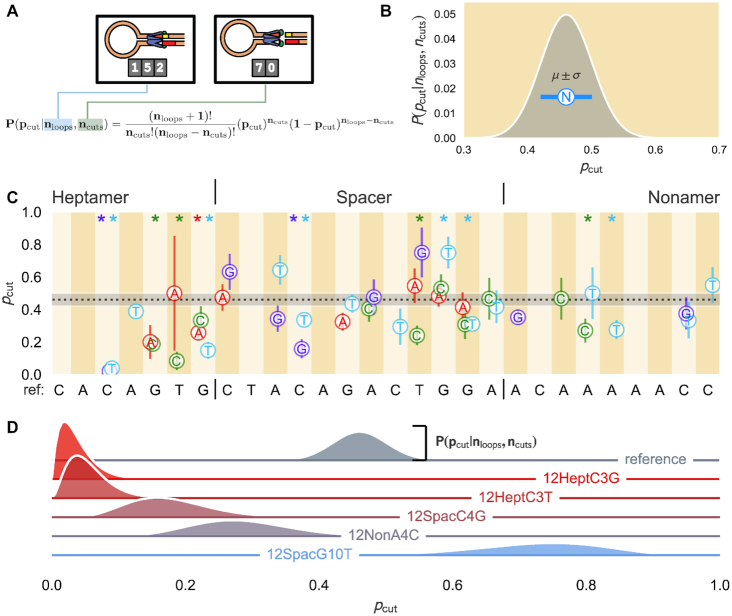
Figure 5.
Cutting probabilities for single bp changes introduced at various positions of the reference 12RSS. (A) For a given RSS, the total number of distinct loops in the assay nloops (in this case, 152 loops) and the subset of those loops that RAG cleaves ncuts (70) are applied to the function shown that identifies the full distribution of the cutting probability pcut of the PC for a 12RSS of interest. (B) Example distribution for a particular RSS, with the most likely cutting probability μ with N for ’nucleotide’ and standard deviation σ shown as a circle with blue error bars, respectively. (C) μ and σ are shown for each synthetic RSS with the dotted black line denoting the most probable pcut for the reference sequence, roughly 0.46, with the gray shaded region setting one standard deviation. Vertical stripes; x-axis labeling; heptamer, spacer and nonamer distinction; and color-coding of nucleotide changes (red for A, green for C, light blue for T and purple for G) are the same as in Figure 3. (D) Ridgeline plot of posterior distributions of the cutting probability, given the number of loops observed and loops that cut (see Supplementary Data) for a subset of the synthetic RSSs (labeled and colored along the zero-line of the respective ridgeline plot). Height of the distribution to the horizontal line of the same color corresponds to the posterior distribution. See the Cutting Probability Model Explorer interactive webpage to see how the posterior distribution depends on the number of loops and cuts observed. Asterisks at the top of certain positions are color-coded to specify the nucleotide whose resultant cutting probability differs from the reference sequence with p-value ≤ 0.05. All p-values for each 12RSS used are reported in Supplementary Figure S5.

