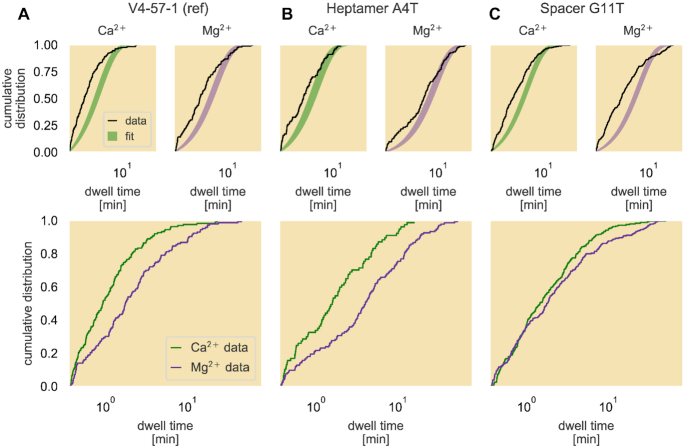
Figure 8.
Empirical cumulative distributions of PC lifetimes with different divalent cations. The empirical cumulative dwell time distributions are plotted in black over the 95% credible region of the fit to an exponential distribution (top row) for the reference sequence (A), a base pair change in the heptamer region of the 12RSS (B) and a base pair change in the spacer region (C). The bottom plots show direct comparisons of the empirical cumulative dwell time distributions collected in either Ca2+- (green) or Mg2+- (purple) supplemented reaction buffer for each RSS. The dwell time axis on all plots are logarithmically scaled.

