Figure 1.
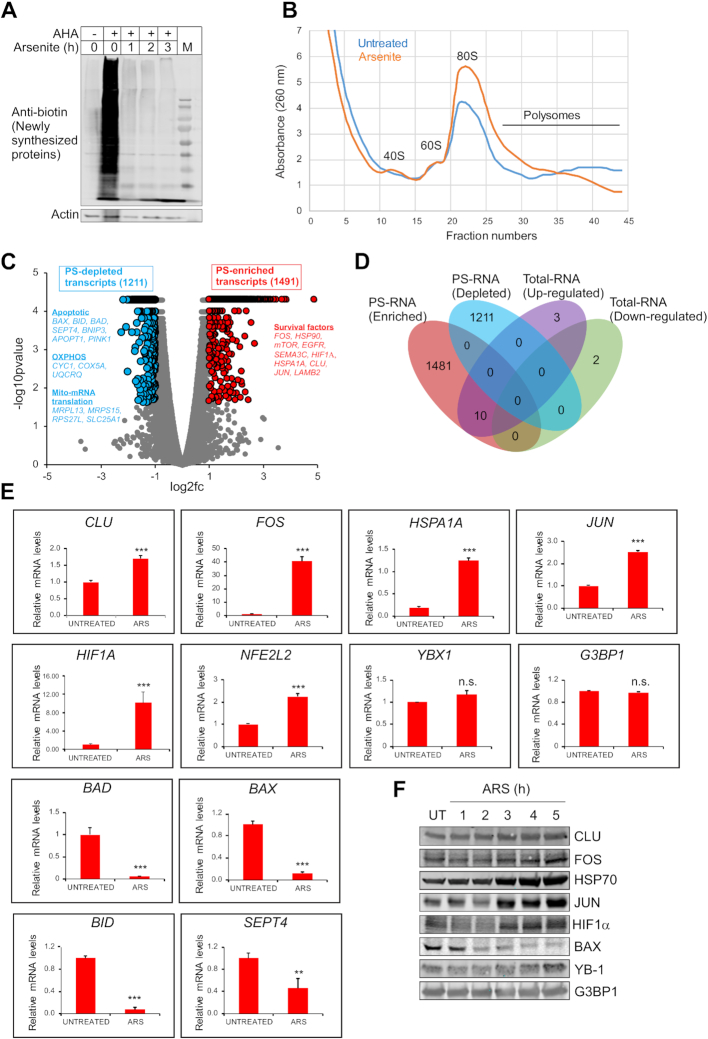
Isolation of PS-enriched and PS-depleted transcripts and their validation. (A) Detection of newly synthesized proteins in untreated or arsenite treated cells using AHA (azidohomoalanine)-mediated CLICK method (36). Cells cultured in AHA-free medium functioned as the control. Note that arsenite stress reduced the synthesis of new proteins. (B) Polysomal trace of untreated or arsenite treated cells. (C) Volcano plot showing PS- enriched or PS-depleted transcripts in response to arsenite treatment. Blue balls on the left depict PS-depleted transcripts (log2fold −1.0 and below, P value < 0.05), with name of a few transcripts and corresponding pathways are shown in blue. Red balls on the right depict PS-enriched transcripts (log2fold 1.0 and above; P value < 0.05), with name of a few transcripts and corresponding pathways are shown in red. Grey balls represent unchanged/non-significant transcripts. (D) Venn diagram comparing PSseq data and total transcriptome data. (E) Validation of PSseq data for selected transcripts by qRT-PCR using polysomal RNA extracted from vehicle-treated/untreated (UT) or arsenite-treated (ARS) cells. Mean values ± SD are shown for three independent experiments. ***P < 0.001; **P < 0.01; ns, non-significant. (F) Validation of PSseq data of selected transcripts using Western blotting of untreated/vehicle treated (UT) or arsenite-treated cells.

