Figure 8.
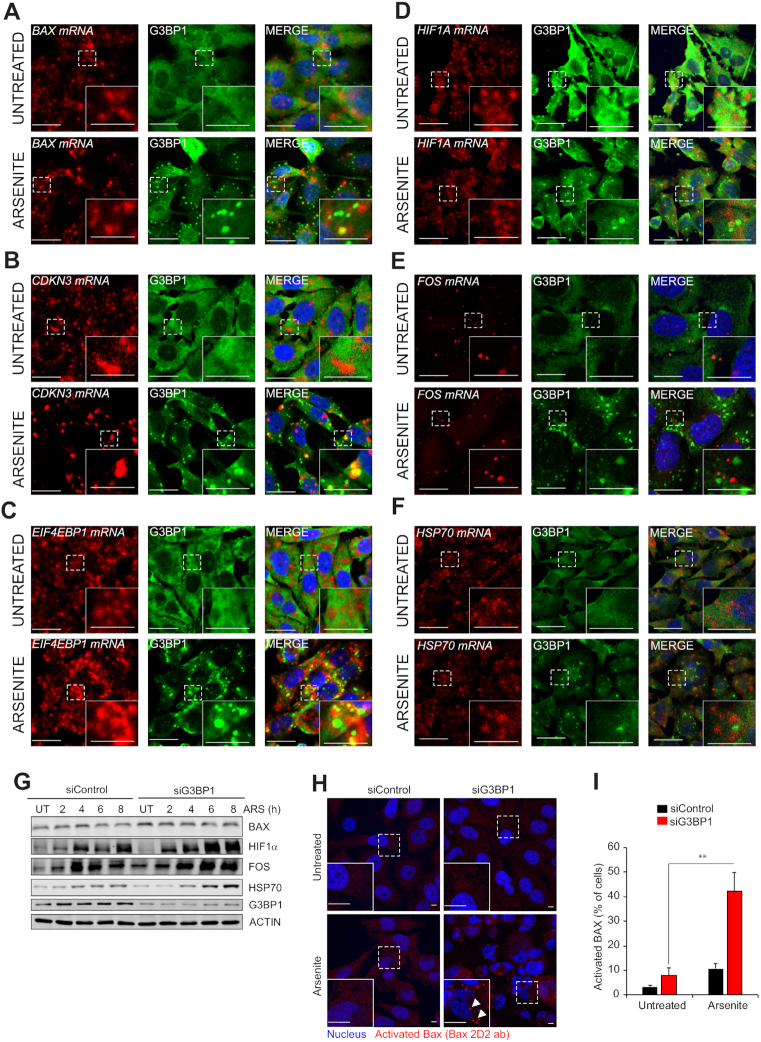
Protein expression and localisation of G3BP1-partitioned transcripts. (A–F) RNA in situ hybridization of different G3BP1-partitioned transcripts using mRNA probes as indicated (red panels). The in-situ slides were subjected to IF staining using anti-G3BP1 antibodies (green panels) to detect colocalization with G3BP1 in presence and absence of stress. A portion of each main figure panel is enlarged and shown as an insert. Scale, 10 um. (G) Western blot analysis of selected G3BP1-partitioned transcripts (see Materials and Methods for details). (H) Activated BAX detected using anti-BAX (2D2) antibodies in untreated or arsenite treated cells. A portion of each main figure panel is enlarged and shown as an insert. White arrows point to the spots representing activated BAX. Scale, 10 um. (I) Quantification of BAX activation. Mean values ± SD are shown for three independent experiments. **P < 0.01.

