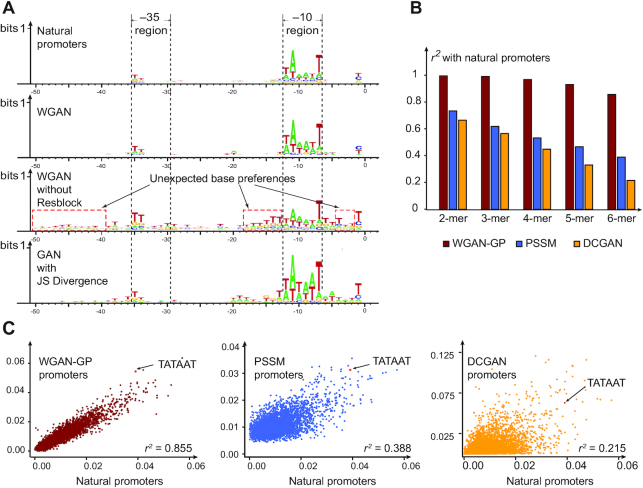
Figure 2.
The -10 and -35 motif and k-mer distribution of PSSM, DCGAN and WGAN-GP generated promoters. (A) The sequence logos of natural promoters, artificial sequences generated by WGAN-GP with resblock, without resblock and generated by original vanilla GAN with JS divergence. (B) R-squared value evaluates the correlation of k-mer frequencies (k = 2–6) between natural promoters and artificial sequences designed by WGAN-GP, PSSM and DCGAN. (C) The 6-mer scatter plot of natural promoters and generated promoters. Each point represents a certain 6-mer. The x- and y-axes represent the k-mer frequencies in natural and generated promoters.

