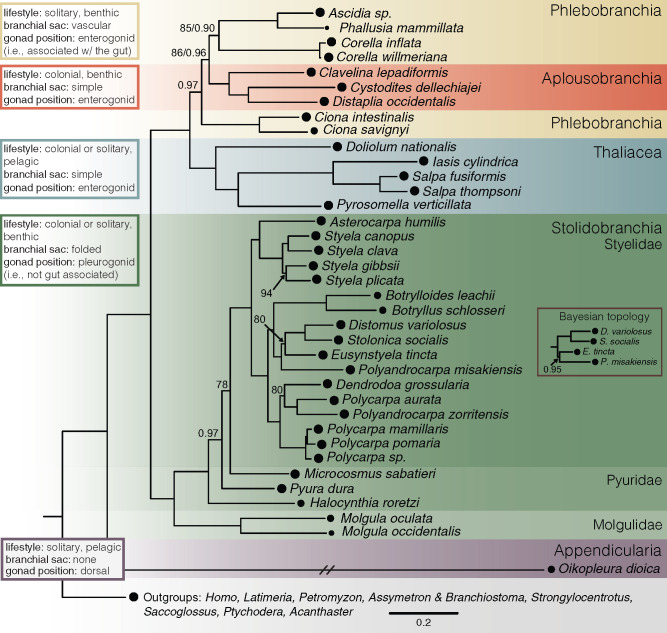
Fig. 2.
—Tunicate phylogeny. Maximum-likelihood phylogeny of tunicates estimated from a concatenated matrix of 210 orthologous loci identified in transcriptome sequences. Colors represent different levels of taxonomic organization. Circles at the tips represent the occupancy of that taxon in the data matrix. The inset labeled “Bayesian topology” represents the difference between the ML and Bayesian topologies. Nodes with bootstrap values <95 and/or posterior probability values <0.98 are labeled. The branch leading to Oikopleura dioica was shortened to fit the figure dimensions. The Corella inflata transcriptome was generated in this study. Transcriptomes for other taxa were from Kocot et al. (2018), Alié et al. (2018), and Delsuc et al. (2018). (See supplementary table S1, Supplementary Material online, for full details.) Alignment and tree files are available at https://github.com/josephryan/2019-DeBiasse_etal_CorellaGenome.

