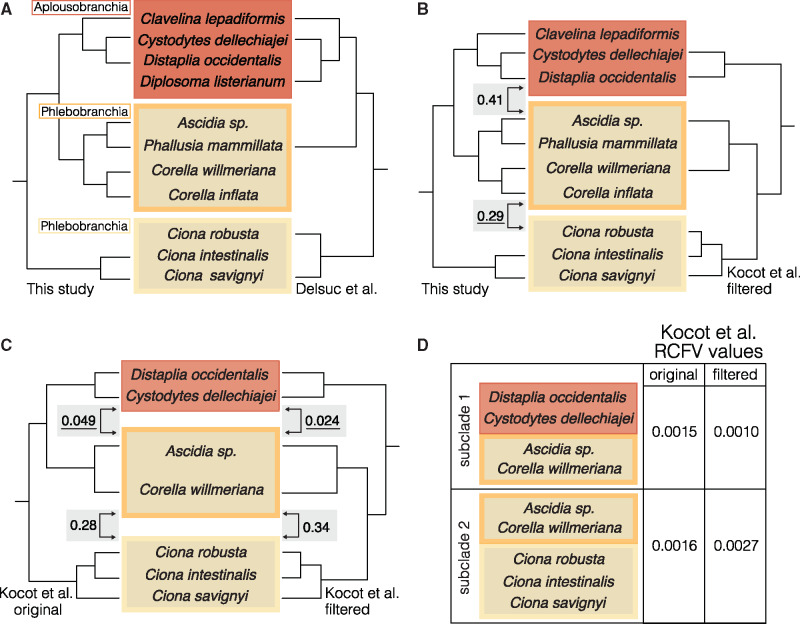
Fig. 3.
—Alternative topologies and measures of compositional heterogeneity. Yellow shading indicates taxa in Phlebobranchia and red shading indicates taxa in Aplousobranchia. (A) Phylogenetic relationships inferred in this study (left) are congruent with those inferred in Delsuc et al. 2018 (right). (B) Phylogenetic relationships inferred in this study (left) conflict with those inferred in Kocot et al. 2018 (right). The numbers in gray boxes are chet index values calculated by comparing amino acid compositions of the clades indicated by the arrows. The underlined chet indices specify which clades have more similar amino acid frequencies, which therefore would be expected to be drawn together due to compositional heterogeneity. (C) Alternative phylogenetic relationships inferred in Kocot et al. (2018) for the original 798-gene data set (left) and RCFV 50-gene filtered data set (right). The numbers in gray boxes are chet indices of the clades indicated by arrows. (D) RCFV values calculated for alternative subclade definitions for the Kocot et al. (2018) original 798-gene data set and RCFV 50-gene filtered data set.

