
Figure 4.
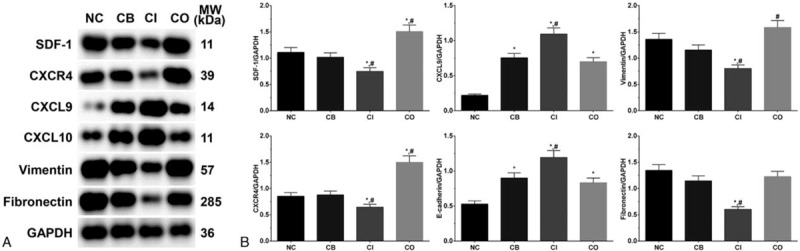
Expression of metastasis related proteins in each group of LS174T cells. (A) Western blotting analysis of each protein. (B) Quantitative analysis of each protein. Each experiment was repeated for 3 times independently. Data was presented as mean ± SD. P < .05 was set as a statistic difference. ∗P < .05 compared with normal control group, #P < .05 compared with cetuximab treatment group.