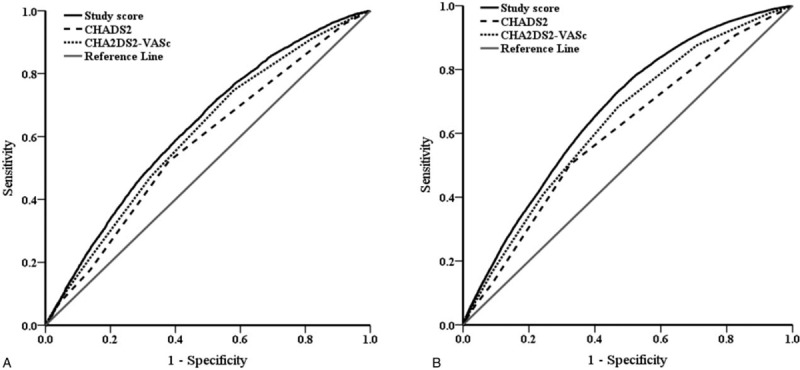
Figure 1.

Receiver operating characteristic (ROC) curves of 3 different risk scoring systems in predicting a 3-year atrial fibrillation risk after ischemic stroke in the diabetes mellitus (DM) (A) and non-DM (B) cohort. 1A. ROC curves of the proposed model (area under the curve [AUC], 0.630; 95% confidence interval [CI], 0.623–0.638), CHADS2 (AUC, 0.576; 95% CI, 0.568–0.583) and CHA2DS2-VASc (AUC, 0.607; 95% CI, 0.600–0.615) in DM cohort. The AUC was significantly larger in the proposed model than in the CHADS2 and CHA2DS2-VASc (both P of delta AUC < .001). 1B. ROC curves of the proposed model (area under the curve [AUC], 0.671; 95% confidence interval [CI], 0.667–0.675), CHADS2 (AUC, 0.600; 95% CI, 0.596–0.604) and CHA2DS2-VASc (AUC, 0.636; 95% CI, 0.632–0.640) in non-DM cohort. The AUC was significantly larger in the proposed model than in the CHADS2 and CHA2DS2-VASc (both P of delta AUC < .001).
