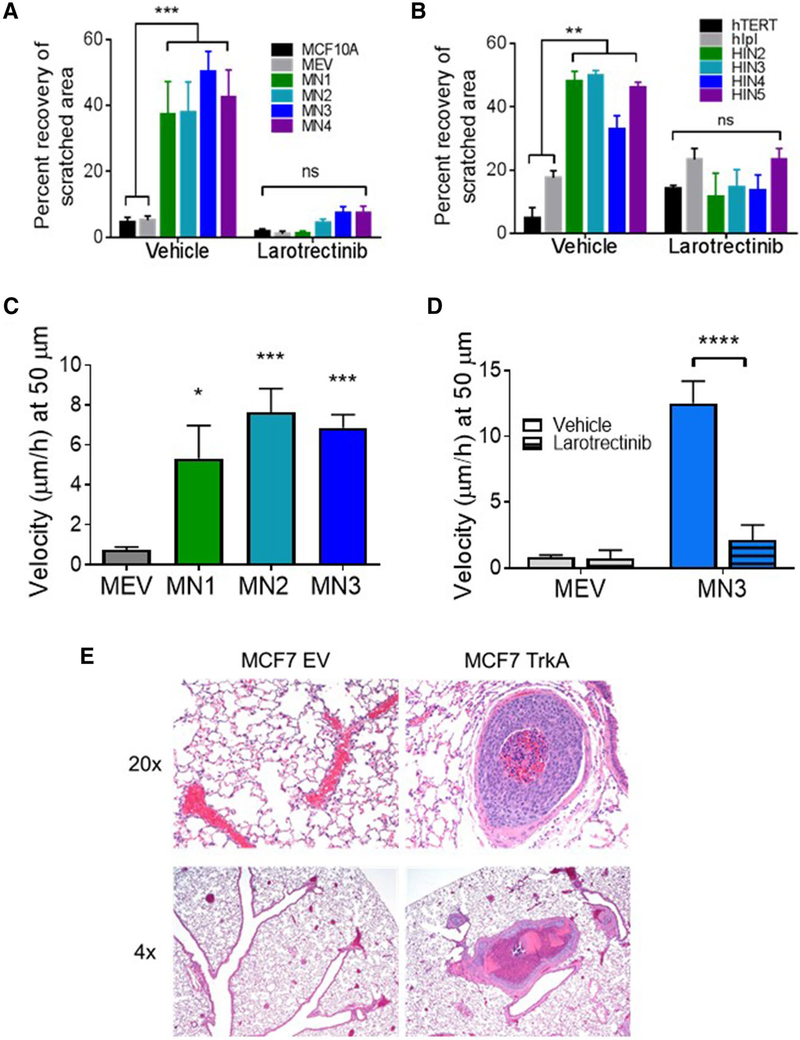
Fig. 5.
TrkA overexpression leads to increased migratory capabilities. a MCF10A TrkA overexpression and b hTERT-IMEC TrkA overexpression panels were plated in growth factor-supplemented media to a confluent monolayer, scratched, and imaged at 0 and 16 h time points ± 2 μM of larotrectinib; percent healing calculated from scratch dimensions quantified with ImageJ MiToBo software. ***P ≤ 0.001, **P ≤ 0.01, as determined by ANOVA. c Microchannel migration assays were performed in 50 μm channels. Individual cells from the MCF10A TrkA overexpression were tracked along a growth factor gradient. Cellular velocity of migrating cells was calculated as the product of speed and persistence (shown individually in Supplemental Fig. S6). ***P ≤ 0.001, *P ≤ 0.05, as determined by ANOVA. d Representative clone was tracked across growth factor gradient in the presence of 1.5 μM larotrectinib. ****P ≤ 0.0001 as determined by unpaired Student’s t test. e Tail vein injection of MCF7-TrkA (TrkA overexpression) and MCF7-EV (empty vector) cells in athymic nude mice (n = 5 per cell line). 2 of 5 mice injected with TrkA overexpression formed tumors. Mice were supplemented with a 17β-estradiol pellet. Representative images of lung sections at ×4 and ×20

