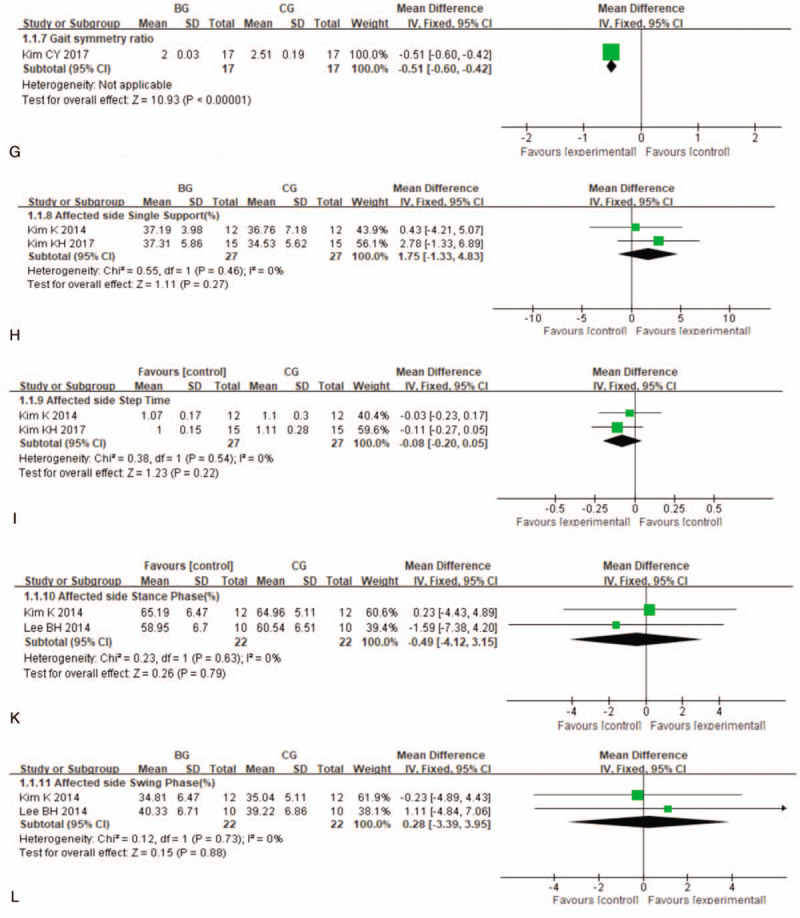
Figure 3 (Continued).

Meta-analysis and forest plot and for gait characteristics. Compared to CG, there is a statistically significant improvement for BG in gait velocity (MD = 6.87, 95%CI: [1.40, 12.33], P = .01, I2 = 3%), cadence (MD = 4.35, 95%CI: [1.26, 7.44], P = .006, I2 = 16%), paretic step length (MD = 4.33, 95%CI: [0.38, 8.27], P = .03, I2 = 30%). BG = backward walking group, CG = control group.
