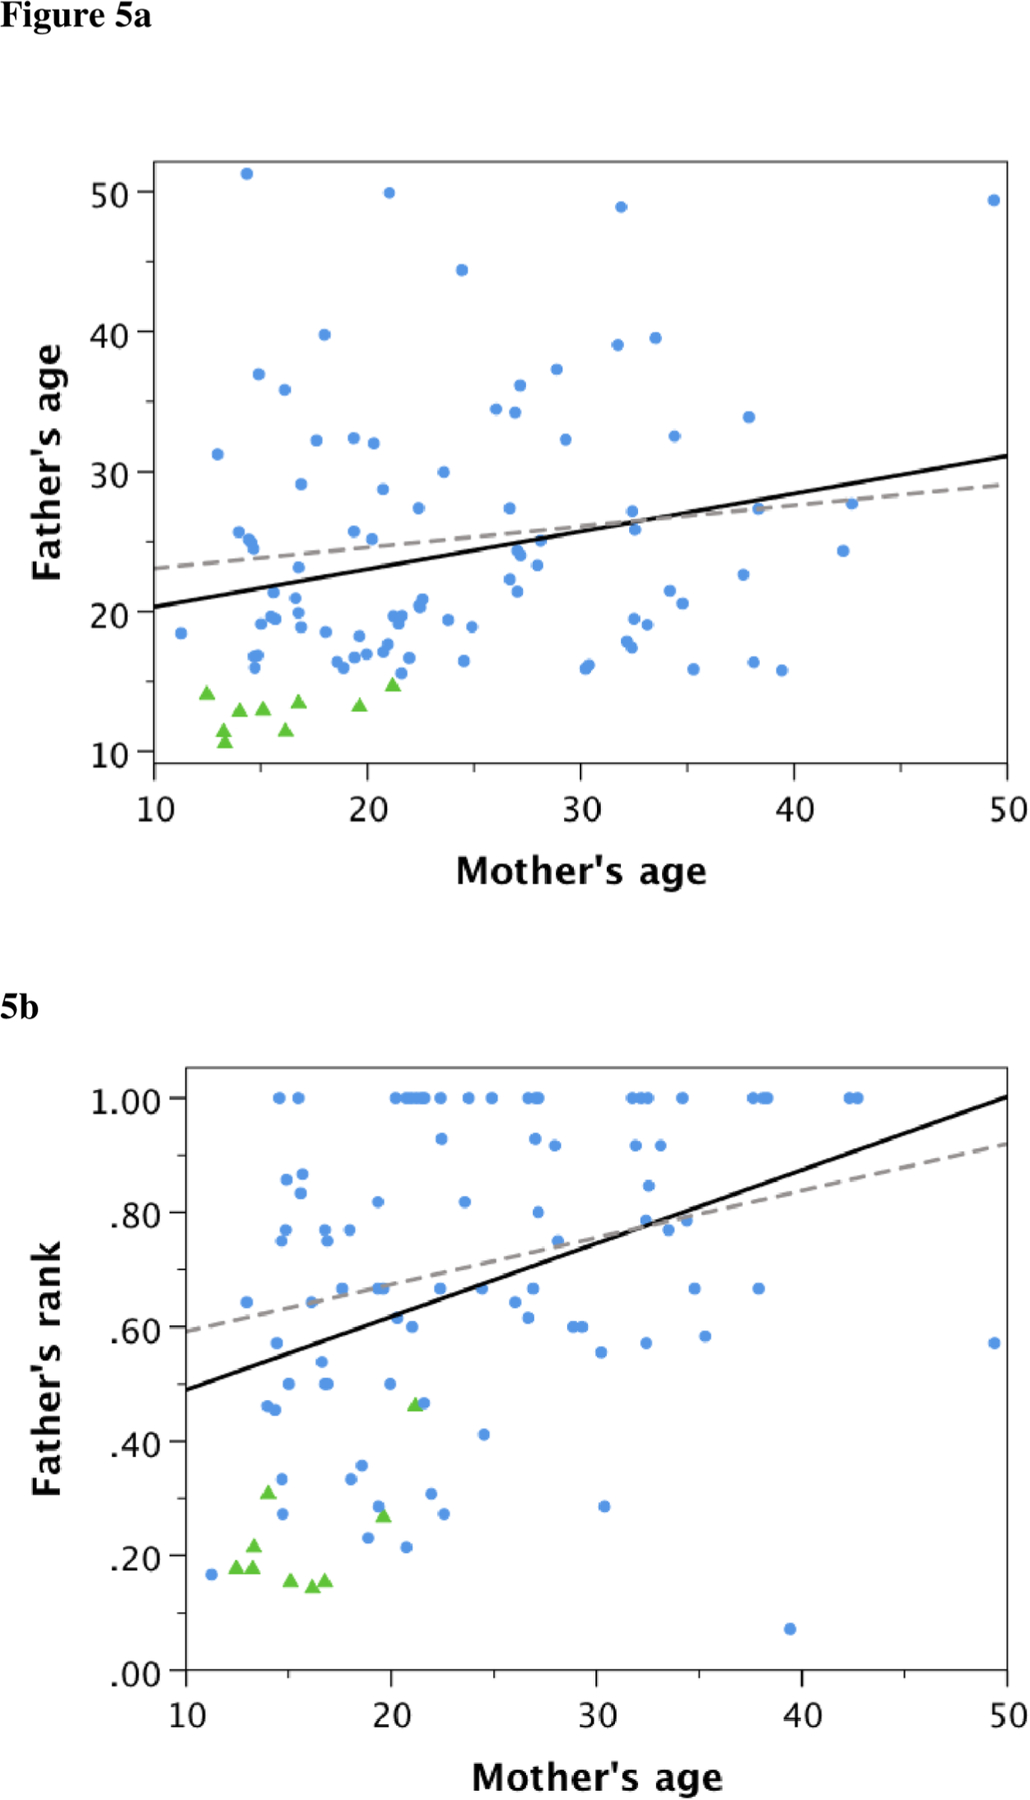
Figure 5a.

The relationship between father’s age and mother’s age across all infants (solid line: Spearman rank correlation, rS=0.237, n=95, p=0.021) and infants with adult (≥15 years) fathers (broken line: rS=0.075, n=86, p=0.495). Triangles represent infants with adolescent (<15 years) fathers. 5b. The relationship between father’s rank in the male dominance hierarchy and mother’s age across all infants (solid line: rS=0.421, n=95, p<0.0001) and infants with adult (≥15) fathers (broken line: rS=0.314, n=86, p=0.003).
