
Figure 1.
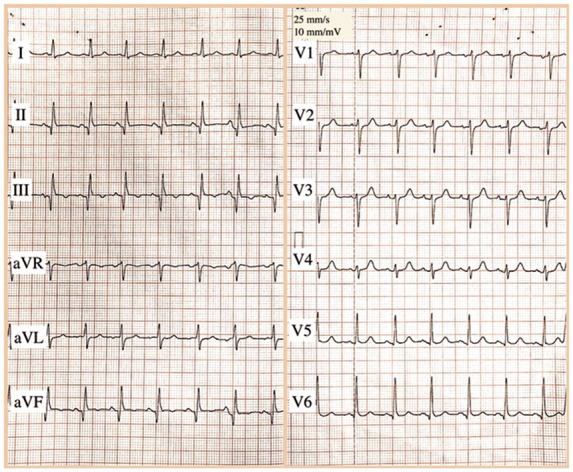
The 12-lead electrocardiogram (ECG) on admission. Sinus rhythm at a rate of 100 b.p.m. with Q waves and negative T waves in the inferior leads.
Official websites use .gov
A
.gov website belongs to an official
government organization in the United States.
Secure .gov websites use HTTPS
A lock (
) or https:// means you've safely
connected to the .gov website. Share sensitive
information only on official, secure websites.
The 12-lead electrocardiogram (ECG) on admission. Sinus rhythm at a rate of 100 b.p.m. with Q waves and negative T waves in the inferior leads.