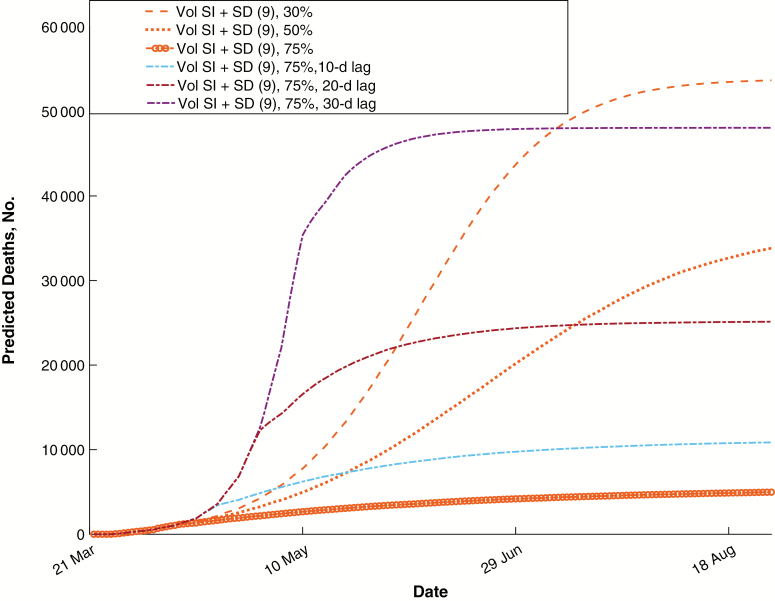
Figure 3.
Effects of delayed implementation on mortality rate. Predicted numbers of deaths are plotted for the strongest set of interventions, considered at varying voluntary ratios and time lags before implementation. Infection could still be suppressed effectively with a 10-day delay, but a 30-day delay greatly increased the predicted death toll. Number 9 in parentheses represents intervention 9 in Methods. Abbreviations: SD, social distancing; SI, self-isolation; Vol, Voluntary.

