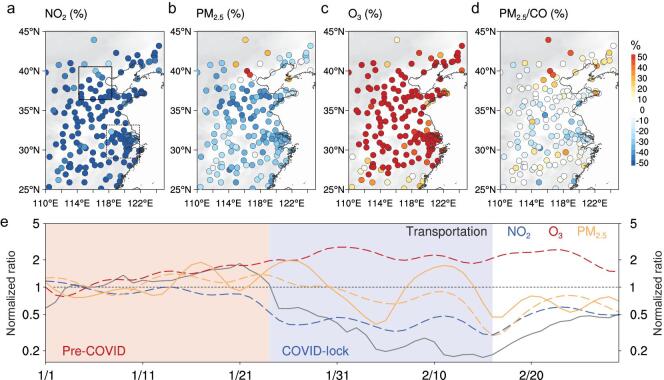
Figure 1.
Changes in air quality before and during the COVID-19 lockdown in eastern China. a–d, Differences in averaged concentrations of NO2, PM2.5, O3 and PM2.5/CO ratio before (1–23 January 2020) and during (26 January–17 February 2020) the COVID-19 lockdown periods at air quality monitoring stations in eastern China. The dashed and solid rectangles in a represent YRD and BTH region, respectively. e, Time series of normalized change in NO2, O3, PM2.5 in eastern China (30°N–40°N, 110°E–120°E) and transportation index in China in January–February 2020. Note: the normalized ratio is calculated using time series with daily variation removed by EEMD filter and scaled with the first 10-day average. The dashed and solid yellow lines in e represent the averaged PM2.5 concentrations in YRD and BTH cities, respectively.

