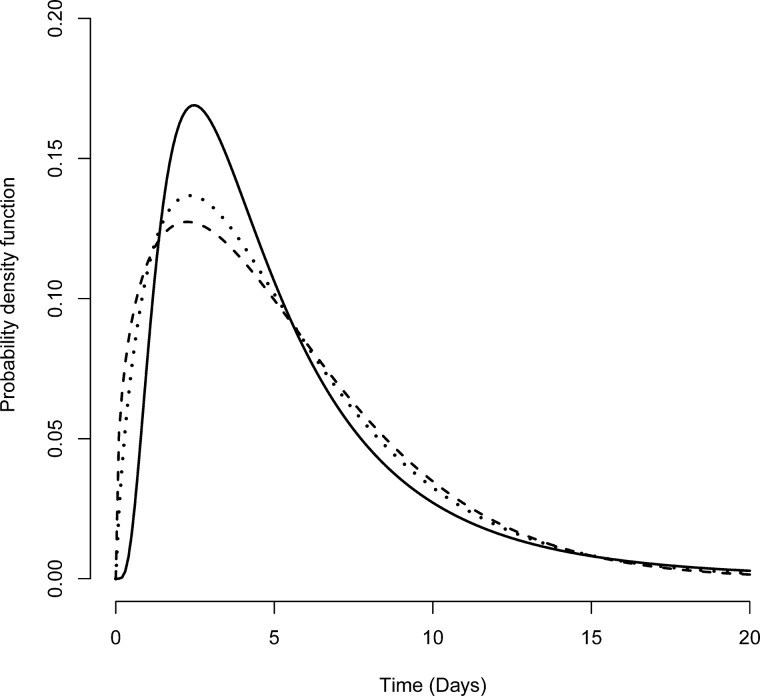
Figure 4.
Probability distributions of the incubation period. Available serial intervals (in days) from 40 patients were fitted with parametric distributions: lognormal (solid line), Weibull (dashed line) and gamma (dotted line). Left, right, and interval censoring were accounted for in the likelihood of probability distributions. The AIC values for these three distributions were 87.4, 86.0 and 86.2, respectively.

