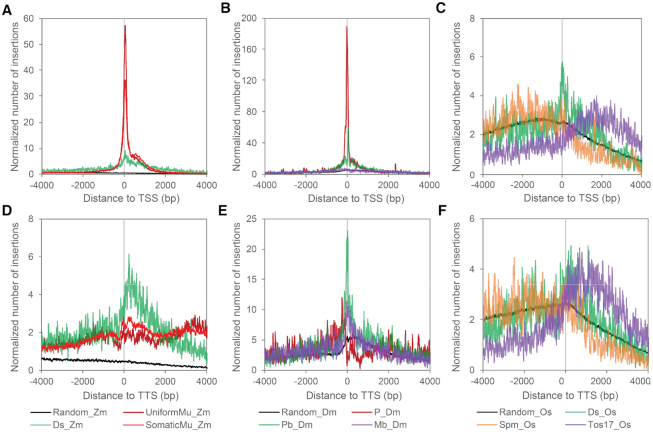
Figure 1.
Characterization of distribution of de novo transposon insertions that are near genes. The figure shows normalized numbers of insertions around TSSs and TTSs of annotated genes. The insertion numbers at each distance was smoothed by computing the mean in a 30-bp rolling window. For both TSS and TTS plots, normalized numbers of genic insertions were plotted on the positive X-axis coordinates and normalized numbers of intergenic insertions were plotted on the negative coordinates. Thus, positive values for both plots represent insertions into the gene body. Randomly selected loci were used as a background control to take into account the fact that although insertions were plotted up to 4 kilobase pairs (kb) away from the TSSs and TTSs, many gene bodies are shorter than 4 kb, and many genes are more or less than 4 kb downstream or downstream from a neighboring gene. Panels in the upper and bottom rows show metaprofiles of transposon insertions in maize (A, D), Drosophila (B, E) and rice (C, F) for regions surrounding the gene TSS and TTS, respectively.

